

The recent recovery in the cryptocurrency market has offered a glimmer of hope to investors. But the question remains: will prices be able to maintain key support levels?
After a correction of around 23%, optimism arises about a possible upward movement. However, doubts remain as to whether this recovery marks the end of the correction phase or whether new downward pressures will continue on the market.
Can Cryptocurrencies Hold $2.237 Trillion? Look at the 0.382 Fibonacci support
The ability of the cryptocurrency market to hold above the 0.382 Fibonacci support level at around $2.237 trillion, and perhaps close above it this month, could indicate a bullish shift. This indicates that the correction phase is coming to an end.
However, if the market fails to maintain this support level, a correction becomes possible. The golden ratio of support About $1.9 trillion.
In case of further downward movement, the crucial Fibonacci support at around $1.45 trillion will come into effect, followed by major support at the 50-month EMA around $1.236 trillion.
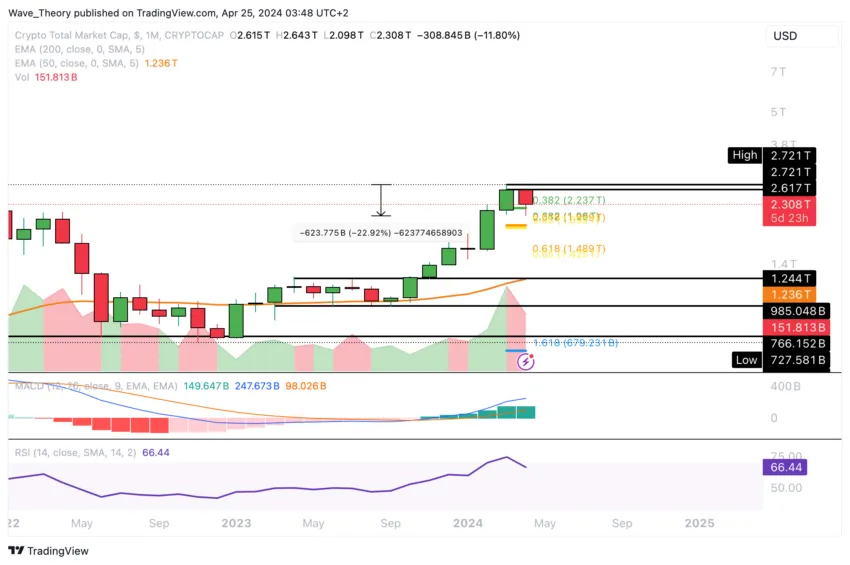
Despite the uncertainty, indicators such as the Moving Average Convergence/Divergence (MACD) histogram and the bullish MACD lines offer some optimism, although a... Relative strength (RSI) remains neutral.
Three strong weeks: crypto above $2.237 trillion Fibonacci support
The cryptocurrency market's holding above the 0.382 Fibonacci support at around $2.237 trillion for three straight weeks is notable, but the lack of significant bullish momentum raises concerns.
Additionally, the impending bearish crossover of the MACD lines and the continued downtrend of the MACD histogram over the past few weeks reinforce the cautious sentiment.
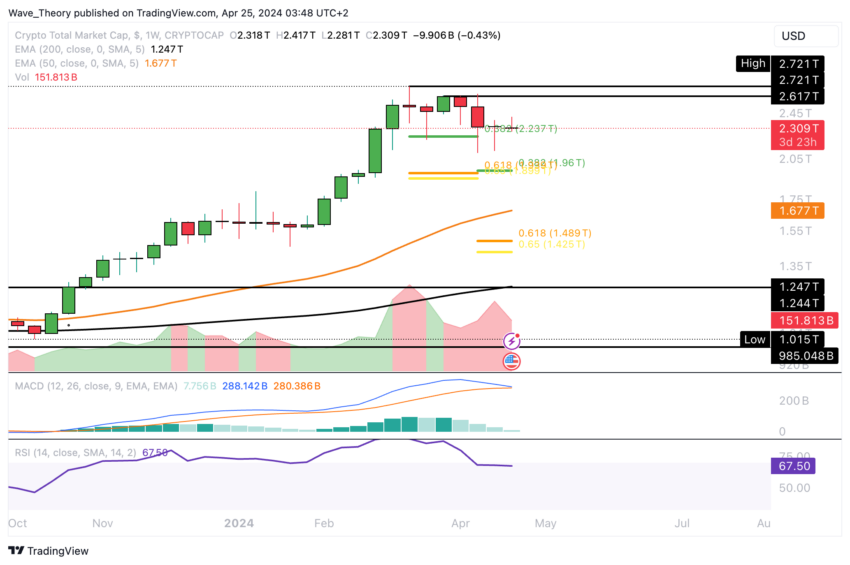
Although the RSI is near overbought levels, its inability to provide clear bullish or bearish signals adds uncertainty about the direction of the market.
Cryptocurrency market sees recovery after recent decline
Recently, the market showed a partial recovery, breaking the 50-day EMA resistance at around $2.336 trillion. This recovery was, however, short-lived. The market has resumed its corrective trend since the day before yesterday.
Despite this, the daily chart still indicates an uptrend in the short to medium term, as evidenced by the presence of a golden cross at the EMAs. Additionally, there are signs of potential bullish momentum, with the MACD histogram showing early signs of a bullish sign and the possibility of a bullish crossover in the MACD lines.
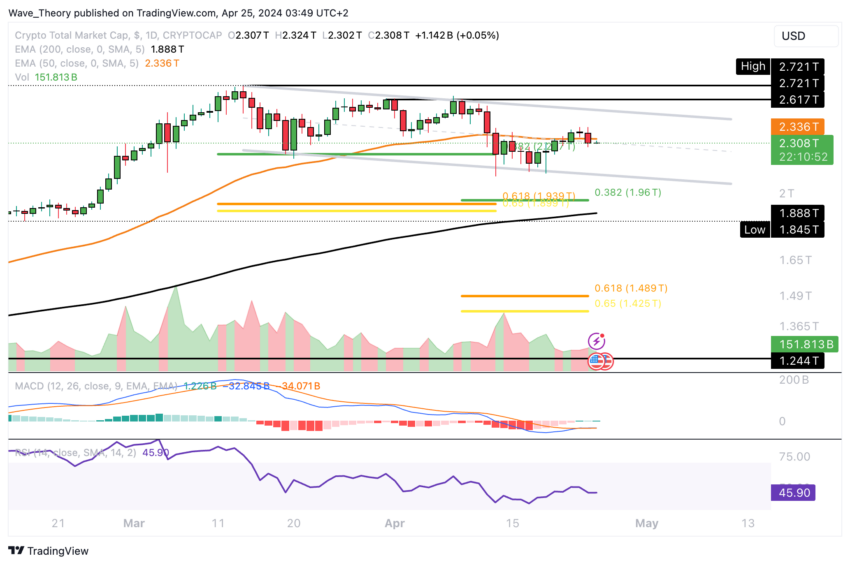
However, the RSI remains neutral, indicating neither bullish nor bearish sentiment. If the market maintains its bullish momentum, it will likely face significant resistance levels ranging from around $2.617 billion to $2.72 billion.
Death Cross Alert: What the 4H Chart Reveals About Market Trends
The formation of a death cross on the 4-hour chart indicates confirmation of a short-term downtrend. Moreover, the bearish sentiment is reinforced by the bearish crossover of the MACD lines and the bearish movement of the MACD histogram.
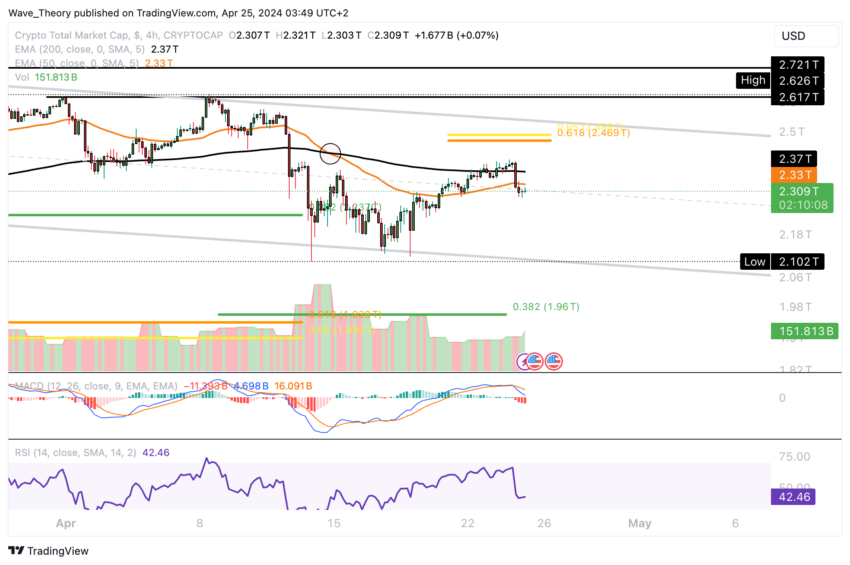
The RSI remains neutral despite these indicators and does not provide any specific signal of bullish or bearish momentum. To signal the end of the corrective phase, the market will need to break through the golden ratio resistance level located around $2.5 trillion.
Bitcoin Reaches Key Fibonacci Support
BTC price has recently shown signs of recovery, but is yet to break through the crucial golden ratio level of around $68,400. A breakout of this level is necessary to signal the end of the corrective movement.
However, the price encountered resistance and entered a correction phase over the past couple of days as it is currently hovering around the 0.382 Fibonacci support at around $64,336. If this support level is broken, the next major Fibonacci support should be around $62,250.
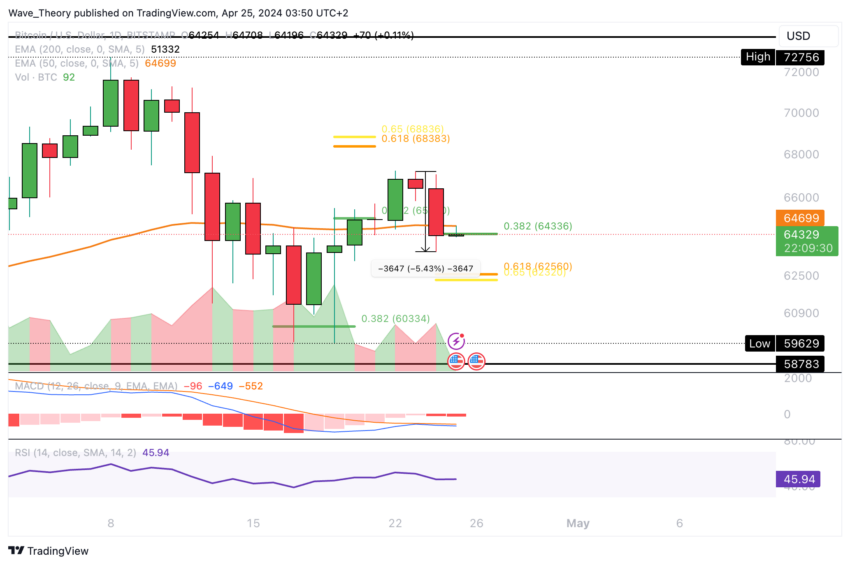
Additionally, the MACD histogram indicates bearish momentum since yesterday, accompanied by a bearish crossover of the MACD lines, while the RSI remains neutral, not providing a clear trend.
Best Cryptocurrency Trading Platforms
Of confidence
Disclaimer
All information published on our website is offered in good faith and for general information purposes only. Therefore, any action, behavior or decision taken by the reader in accordance with this information is solely the responsibility of itself and its affiliates individually, and the site assumes no legal responsibility for such decisions.
الأسواق,أخبار الذكاء الاصطناعي,تحليل العملات البديلة
Comments
Post a Comment