
The price has increased SOL(solana) has been rising gradually since January 23 and is approaching its highest level in 2023.
Although SOL has broken away from short-term resistance, it is still trading below long-term resistance.
Solana price forms a double top
Technical analysis of the weekly chart shows that the price of SOL (solana) reached a 2023 high of $126 in December, but has since declined. The decline reached a low of $79 in January 2024.
The price of SOL (solana) has also increased since then. This created consecutive bullish weekly candles. On February 14, 2024, it reached a high of $119.
At the same time, growth was achieved above the long-term Fibonacci resistance level. It is possible that SOL has created a double top off the 2023 high.
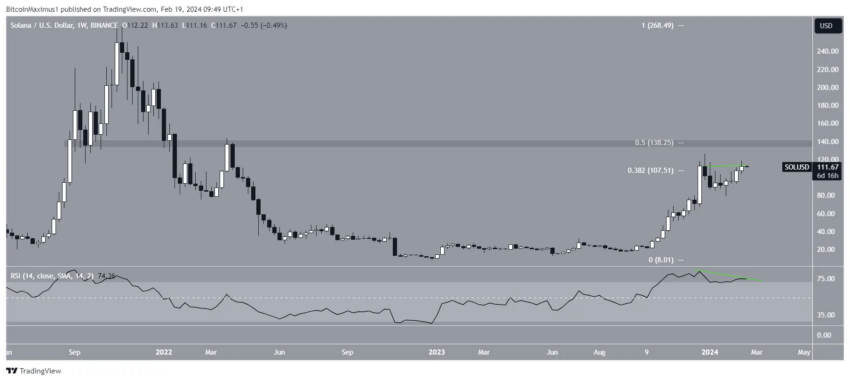
The weekly Relative Strength Index (RSI) also gives a bearish outlook. Market traders use RSI as a momentum indicator to identify overbought or oversold conditions and determine whether an asset should be accumulated or sold.
A reading above 50 and an uptrend indicate that the bulls still have the edge. While values below 50 indicate the opposite.
While the indicator rises above 50, it also generates a bearish divergence (green trend line) that often precedes a downward move.
What do analysts say?
Cryptocurrency Traders and Analysts Cryptocurrency trader Altcoin Sherpa is bullish on SOL.
Where he stated: "$SOL: This graph assumes slow growth. I would expect some type of selling to occur near the highs given the amount of time that passes between each high, but the overall market is still higher right now. I think expecting any major correction for Solana is too much at this point. I'm very bullish on this through 2024, and I think most will make more dollars by just buying here and sitting on it for a few months rather than trying to wait for a 20% correction.”
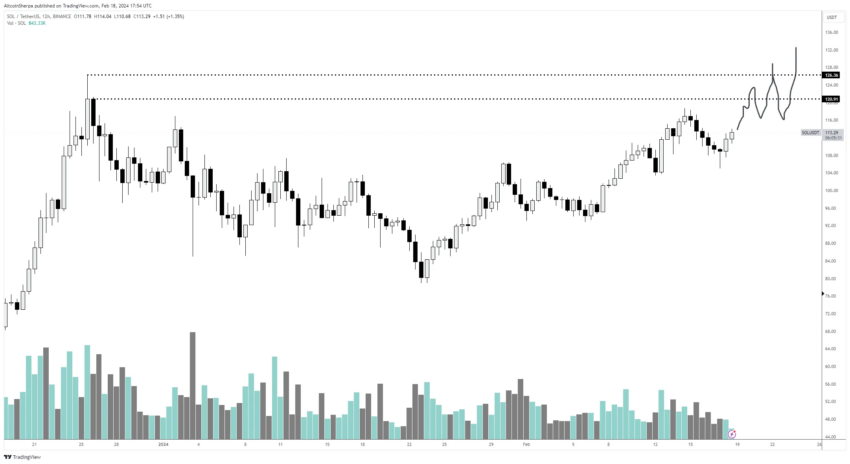
InmortalCrypto noted that SOL has surpassed BNB in terms of market capitalization ranking. However, after this tweet, the price of SOL fell below BNB. Sam Mti is thrilled that the SOL price is approaching $120.
Solana Price Forecast: Will there be new highs in February?
While there is no weekly chart listed, the daily chart offers a more optimistic outlook. This is due to price action, wave counting and RSI readings.
Shows price movement SOL The price moved and closed above the $105 resistance area. This corresponds to an RSI increase above 50 (green symbol).
In addition, the wave marking indicates that SOL is in the fifth and final wave of its upward movement that began in June. Technical analysts use Elliott Wave theory to identify long-term repeating price patterns and investor psychology. This helps them determine the direction of the trend.
If the calculation is correct, SOL will peak near the next long-term resistance at $145, which is 30% above the current price.
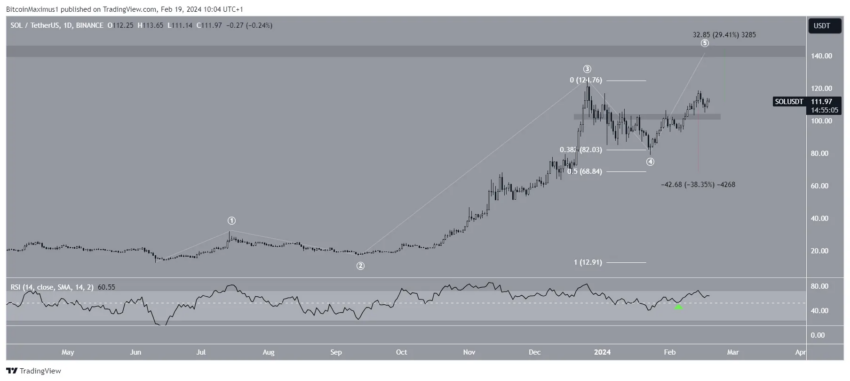
Despite the bullish price outlook for SOL, a close below $105 means the price is still correcting. After this, SOL could fall 40% to the next nearest support at $69, which was created by the 0.5 Fibonacci retracement support level.
[embed]https://www.youtube.com/watch?v=Tg_jq3YxUAI[/embed]
Denial of responsibility
All information published on our website is offered in good faith and for general information purposes only. Therefore, any actions, actions or decisions taken by the reader in reliance on this information are solely the responsibility of it and its affiliates individually, and the site does not accept any legal liability for these decisions.
أخبار,SOL,العملات الرقمية,العملات المشفرة
Comments
Post a Comment