

Over the past three days, there has been a notable increase in the number of unique intraday trades and unique day traders. Which indicates the start of a new upward trend in the price of the currency BONK. Currently, the price of BONK is based on the Relative Strength Index (RSI) of 57. This level indicates that the asset is neither overbought nor undervalued. Which indicates a stable and healthy assessment.
Additionally, bullish sentiment gains additional support as BONK's short-term exponential moving averages (EMA) begin to break above long-term lines. This indicates a favorable moment for investors and indicates the possibility of continued bullish momentum.
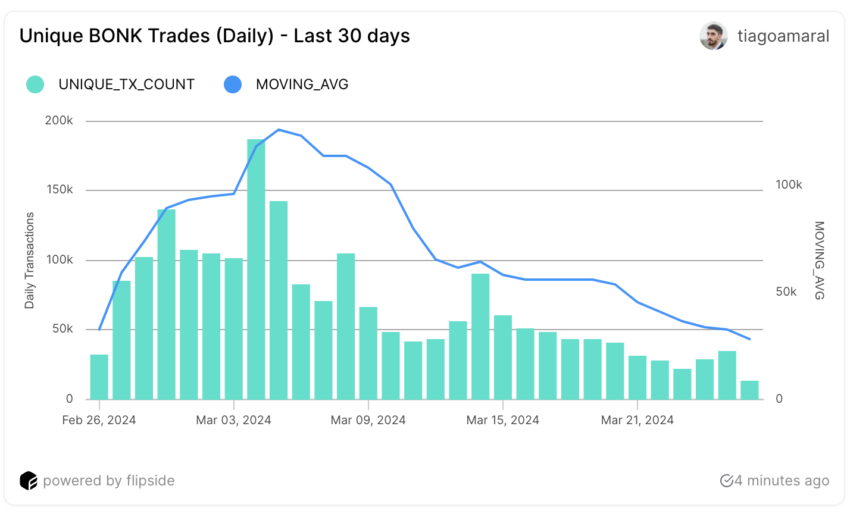
BONK Coin Activity Increases Again
On March 4, BONK reached an all-time high. Daily trading reached 187,000 transactions. But this peak was fleeting. Shortly after, it fell to its 30-day low of 22,200 transactions on March 23. The 7-day moving average of BONK transactions continues to decline. However, the last three days have shown promising signs. Business activity began to recover, increasing from 22,200 on March 23 to 34,800 on March 25.
Likewise, the engagement pattern of day traders reflects this volatility. After reaching a peak of 23,200 unique traders on the same day as trading volume, the subsequent decline led to a period of stabilization in mid-March.
Read more: What are meme coins?
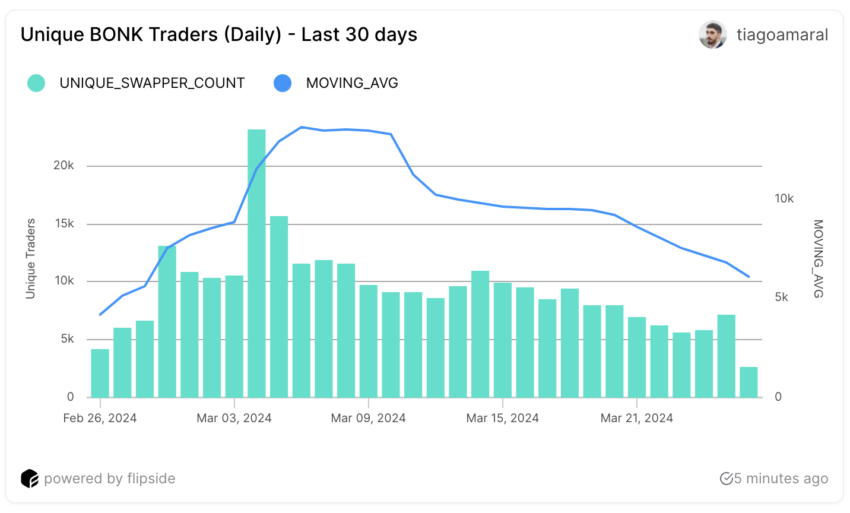
This stability represented the calm before the gradual increase in merchant activity observed in recent days. It increased from 5,660 traders on March 23 to 7,170 traders on March 25.
As the 7-day moving average of daily trader counts continues to decline, the resurgence of trades and trader counts over the past few days indicates a revitalization of interest in BONK.
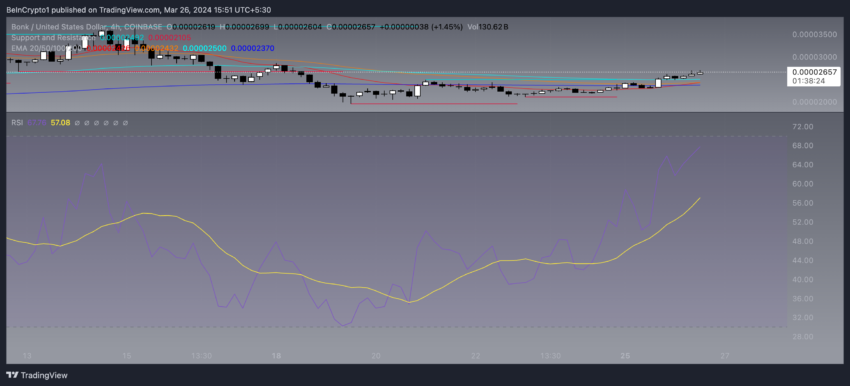
The RSI is currently at 57
BONK stock's relative strength index (RSI) rose from 35 to 57 in six days. This momentum oscillator, designed to measure the magnitude of recent price movements to assess overbought or oversold conditions, operates on a scale of 0 to 100.
When the RSI reaches a level near 35, it often indicates that the asset may be undervalued or oversold. The marked increase in the RSI to 57 shows significant recovery and bullish momentum in BONK price. This also puts him in the “Goldilocks zone”.
This zone indicates a stable market where the asset, perhaps undervalued, is not overbought or at risk of reversing from a high valuation. They are ideally positioned to show growth potential, allowing investors to hope for further gains without fear of an overvalued market leading to rapid corrections.
Therefore, the rise in BONK stock's RSI from 35 to 57 quickly shows growing investor confidence, which could pave the way for continued positive momentum.
BONK Price Prediction: A new bullish wave?
Recently, one of BONK's short-term exponential moving average (EMA) lines crossed above the long-term EMA line, indicating an uptrend known as a golden crossover. This technical indicator is particularly important because it often predicts long-term upward momentum in the price.
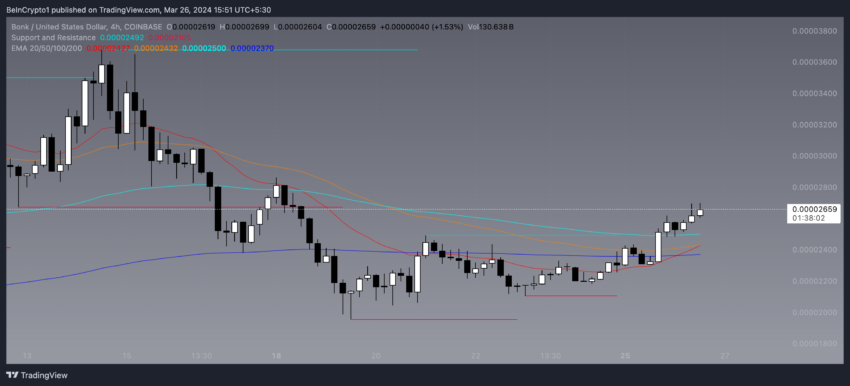
By focusing more on newer price data than older data, EMA lines provide insight into emerging market trends by reacting more quickly to price changes. The golden cross seen in BONK's performance indicates growing optimism among investors and indicates the possibility of a significant price rise.
BONK is currently facing a critical resistance level at $0.000036. Crossing this threshold could send its price to a new high of $0.000047, which could lead to a potential price rise of 80%. However, if BONK fails to hold the support level, the price could fall to $0.000019.
Best Cryptocurrency Trading Platforms
disabled:bg-grey-300 disabled:border-grey-300 disabled:text-grey-100 bic-c-button-secondary mt-4" rel="noopener">
Learn more
Of confidence
Disclaimer
All information published on our website is offered in good faith and for general information purposes only. Therefore, any action, action or decision taken by the reader in accordance with this information is solely the responsibility of it and its affiliates individually, and the site assumes no legal responsibility for such decisions.
الأسواق,العملات الرقمية,العملات المشفرة
Comments
Post a Comment