

Over the past week, Fetch.ai Token (FET) stock price has become one of the best performing assets and reached an all-time high.
But these gains have been accompanied by profits, and some groups of FET investors have not refrained from selling their assets to account for said profits. Will this lower the price?
Fetch.ai (FET) Whales are moving for sale
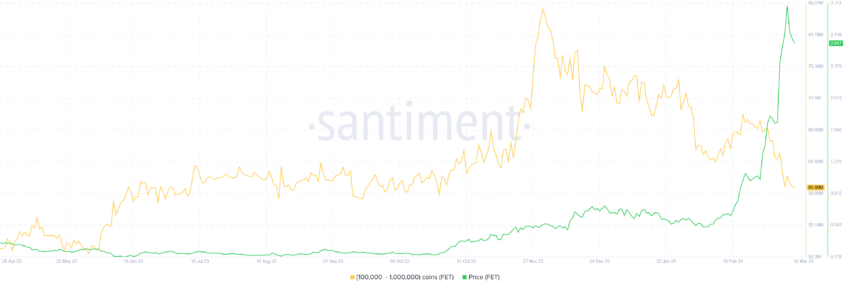
Within a week, FET investors, particularly whale holders, chose to dump their holdings as prices rose. Addresses holding between 100,000 and 1 million FET tokens sold over 9 million FET worth $24.3 million.
As the altcoin continues to reach an all-time high of $3.07, the selling is becoming more and more significant. This reduced the large wallet supply to 60.8 million FET coins. Naturally, this naturally led to the price falling as it became Balance of supply and demand imbalance.
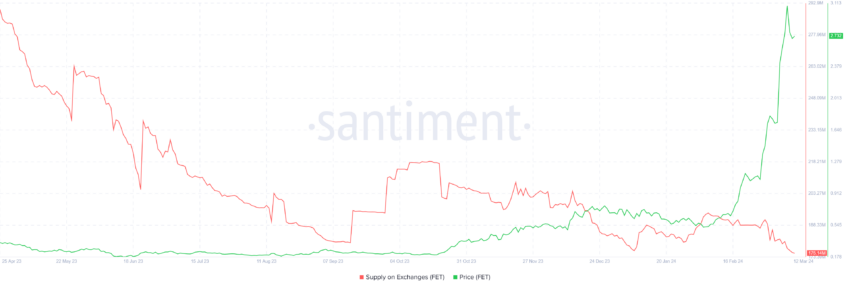
However, retail investors appear to be experiencing this, even though they have much less control over the circulating supply. The total exchange supply is decreasing, indicating that investors are accumulating FET.
Since the beginning of March, approximately 11 million FET tokens worth $29.7 million have been withdrawn from the wallets of these exchanges. This shows that optimism still prevails, but as profit-taking intensifies, this optimism is also likely to dissipate.
FET Price Forecast: A drop on the way?
Given the whale sell-off and price action, further declines appear to be the most likely outcome. Fetch.ai price, at the time of writing, is trading at $2.63, closing in on the support line at $2.46.
The Relative Strength Index (RSI) is already below the neutral line of 50.0 in the bearish neutral zone. The Relative Strength Index is a momentum oscillator that measures the speed and variability of price movements. It helps identify overbought or oversold conditions for an asset, indicating potential reversal points in the price trend.
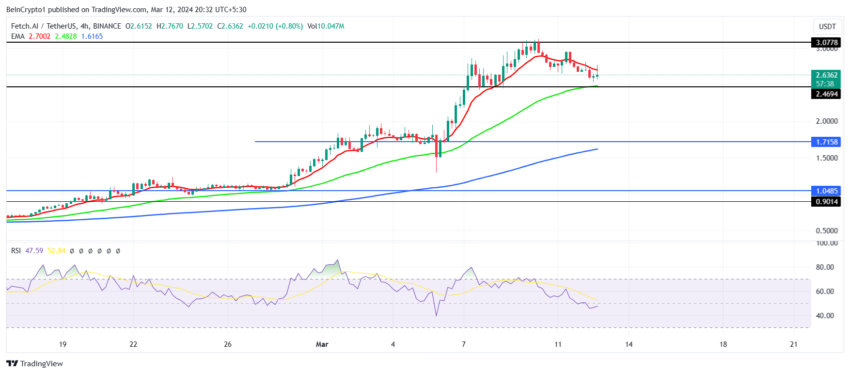
The presence of the indicator in the bearish zone indicates that the bullish sentiment is decreasing, and a prolonged presence of the indicator in this zone will be negative for the price movement. This could mean that FET could cross the support line at $2.46, which coincides with the 100-day exponential moving average (EMA), and fall to $2.00.
However, if the altcoin finds some support from retail investors, it could bounce off the $2.46 support level. This should allow Fetch.ai price to consolidate above this mark until it regains bullish momentum to attempt to break the $3.07 resistance level again to invalidate the thesis bearish.
Best Cryptocurrency Trading Platforms
disabled:bg-grey-300 disabled:border-grey-300 disabled:text-grey-100 bic-c-button-secondary mt-4" rel="noopener">
Learn more
Of confidence
Disclaimer
All information published on our website is offered in good faith and for general information purposes only. Therefore, any action, behavior or decision taken by the reader in accordance with this information is solely the responsibility of itself and its affiliates individually, and the site assumes no legal responsibility for such decisions.
الأسواق,العملات المشفرة
Comments
Post a Comment