

Face the price Ripple XRP recently found resistance at the golden ratio level at around $0.65, where it faced a bearish rejection at this crucial Fibonacci resistance.
This rejection indicates a tough time ahead for Ripple’s price trajectory.
Downward trend in Ripple XRP prices?
A few days ago, Ripple price approached the crucial golden ratio resistance at $0.65, but was rejected lower after several failed attempts to break it. As a result, Ripple pulled back to find support near the golden ratio at $0.55, and from there it witnessed an upward rebound.
Note that a golden cross appeared on the daily chart, indicating an upward trend in the short and medium term.
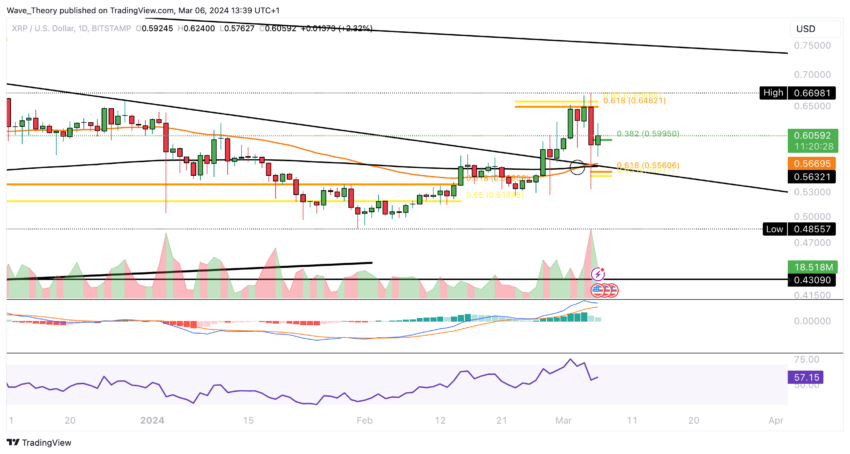
However, the Moving Average Convergence/Divergence (MACD) histogram is down since yesterday, although the MACD lines maintain a bullish crossover while the Relative Strength Index (RSI) remains neutral.
XRP 4-hour chart golden crossover
A golden crossover occurred on Ripple's 4-hour chart, confirming the short-term uptrend, although the MACD lines are still crossed to the downside. Despite this, the RSI is neutral and the MACD histogram shows bullish momentum.
However, XRP faces resistance at the 50-4H-EMA level around $0.608, hampering its advance.
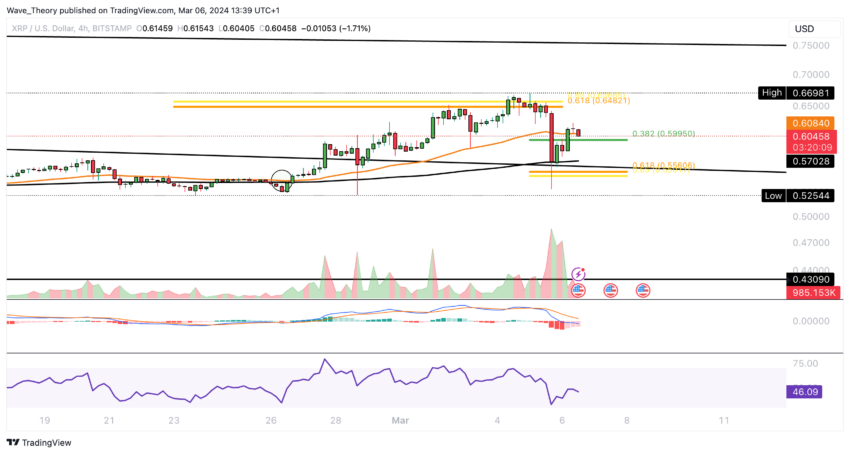
As a result, Ripple may refuse to find support near the golden ratio at $0.55 unless it manages to break through the golden ratio resistance at $0.65 to end the correction.
Ripple Weekly Chart: Bullish Indicators
In the weekly chart of Ripple XRP, a golden cross indicates a medium-term uptrend, supported by an uptrend in the MACD histogram. Although the MACD lines are about to cross to the upside, the RSI remains neutral.
Breaking the golden ratio resistance at $0.65 could push Ripple towards major Fibonacci resistance at $0.75, with further resistance at $0.923.
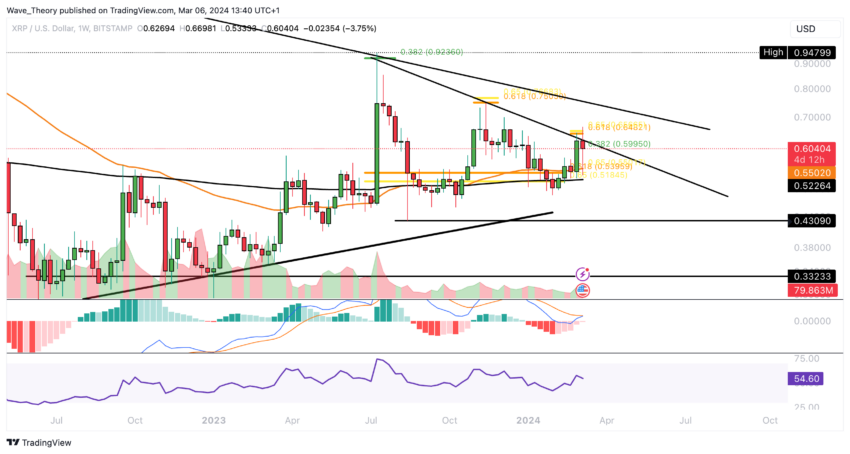
Conversely, if Ripple XRP declines, it could find support near the golden ratio at $0.54, where the 50-week EMA is also located.
Ripple Monthly Chart: MACD Shows Uptrend
In the monthly chart, Ripple's
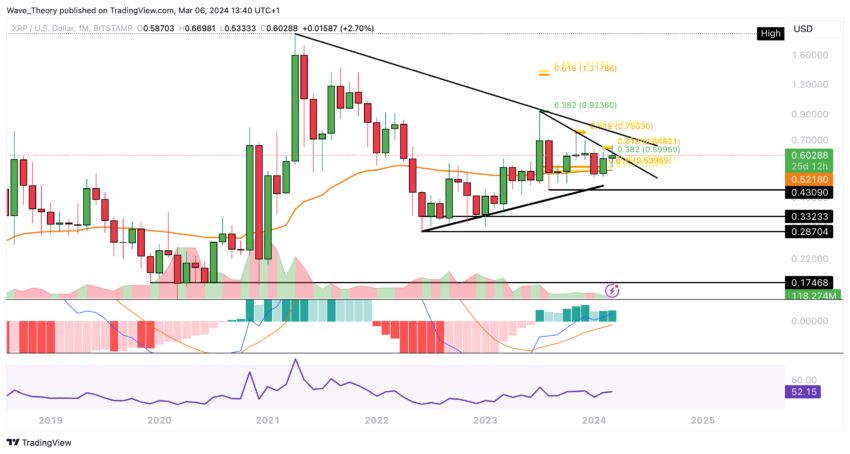
This bullish movement has been ongoing for months, but Ripple has yet to see a final upward reversal. It is necessary to break the golden ratio resistance at around $1.35 to achieve this.
Ripple’s XRP Price Still Bearish Against Bitcoin
Ripple price is seeing a notable downtrend against Bitcoin, with the next important support level for XRP price estimated at around 0.0000062 BTC.
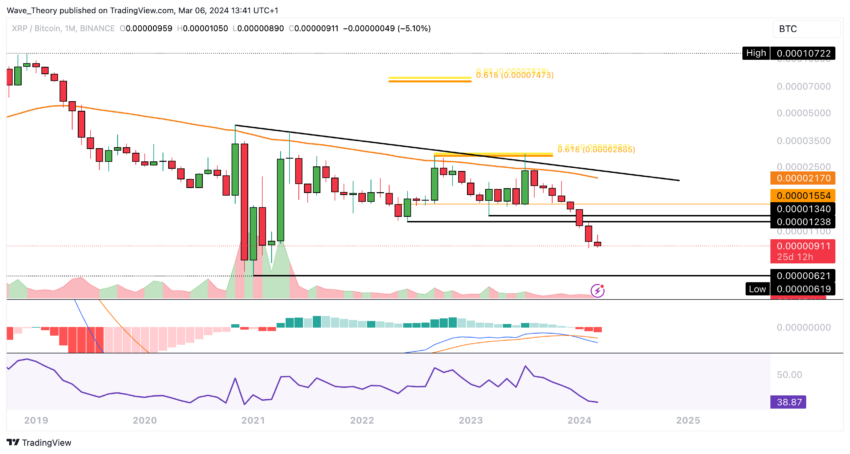
Additionally, on the monthly chart, clear bearish signals are visible as the MACD lines have crossed negatively, and the MACD histogram shows an increasing bearish slope while the RSI remains in the neutral zone.
Best Cryptocurrency Trading Platforms
disabled:bg-grey-300 disabled:border-grey-300 disabled:text-grey-100 bic-c-button-secondary mt-4" rel="noopener">
Learn more
Of confidence
Disclaimer
All information published on our website is offered in good faith and for general information purposes only. Therefore, any action, behavior or decision taken by the reader in accordance with this information is solely the responsibility of itself and its affiliates individually, and the site assumes no legal responsibility for such decisions.
الأسواق,الريبل,العملات الرقمية,العملات المشفرة
Comments
Post a Comment