
The price of Bitcoin Cash (BCH) is going through an interesting phase, experiencing strong market interest despite a conflicting signal. Although it finds support at the $617 level, the digital currency faces crucial resistance that could lead to significant price movements. This scenario presents a complex but potentially bullish picture for Bitcoin Cash.
Bitcoin Cash Shows Strong Interest
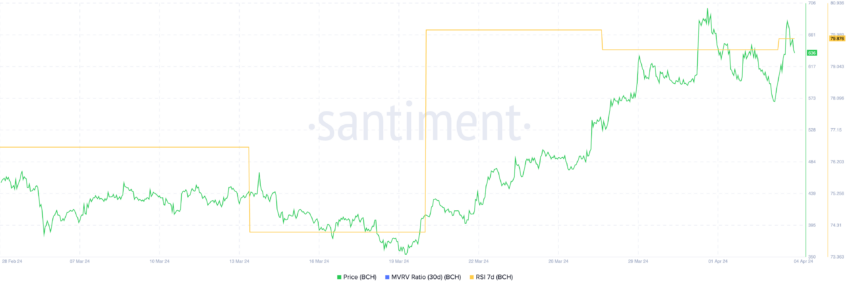
Bitcoin Cash's current relative strength index (RSI) at 79 matches levels seen during its March rally, indicating significant momentum. The Relative Strength Index (RSI) is an oscillator that measures the speed and variability of price movements, with values above 70 generally indicating that the asset is overbought and below 30 indicating that it is oversold.
Despite its overbought connotation, a rising BCH RSI does not necessarily predict a bearish event. Rather, it highlights strong investor interest and continued buying activity. This may indicate continued price growth, supported by a market willing to invest in Bitcoin Cash At or above current price.
Bitcoin Cash’s 30-day market value to realized value (MVRV) ratio is 13%. This is what some analysts may consider bearish.
👈Read more: The 9 Best Bitcoin Cash Wallets in 2023
Despite the drop to 13%, it is worth noting that Bitcoin Cash has made price gains of similar percentages in the past. This indicates the potential for continued investments and higher prices, reinforcing the overall bullish outlook for the cryptocurrency.
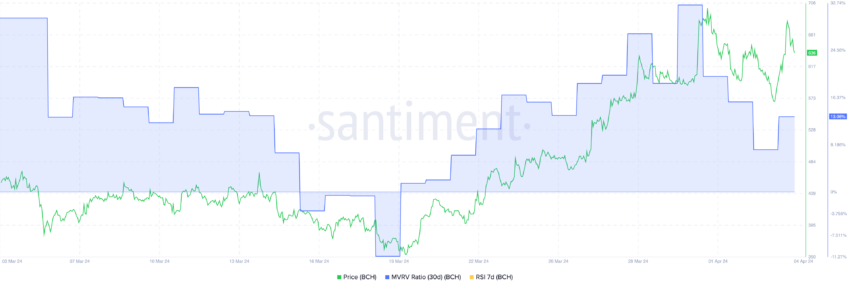
The MVRV ratio compares market value to realized market value to assess whether an asset is undervalued or overvalued. While there is no universally perfect MVRV ratio, extreme values can indicate potential corrections in the market.
BCH Price Prediction: $733 Level Is Within Reach
With strong support at $617 and the next major resistance at $673, a break of this barrier could put BCH on the path to $733, returning to its highest valuation since May 2021.
👈Read more: Discover the best Japanese candlestick patterns in cryptocurrencies in 2024
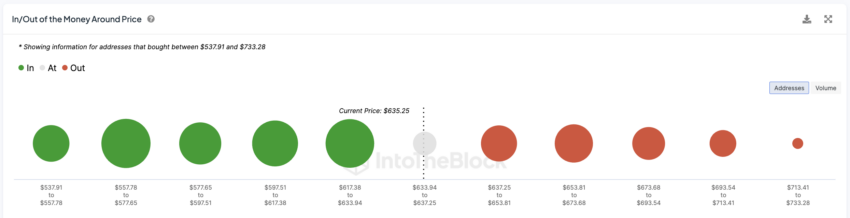
The In/Out of the Money Around Price (IOMAP) chart is a valuable tool in this analysis. It indicates important price levels based on historical buying and selling activity.
This information highlights key support and resistance levels identified by investor positions. With a collapse that could send the BCH price down to $577.
Best Cryptocurrency Trading Platforms
Of confidence
Disclaimer
All information published on our website is offered in good faith and for general information purposes only. Therefore, any action, behavior or decision taken by the reader in accordance with this information is solely the responsibility of itself and its affiliates individually, and the site assumes no legal responsibility for such decisions.
تحليلات,العملات الرقمية,العملات المشفرة,بيتكوين كاش,بيتكوين كاش BCH,سعر بيتكوين كاش BCH
Comments
Post a Comment