

Witness Bitcoin BTC Price Relative stability of its movements, but this situation may not last long, as the price must finally break out of the sideways range in which it has been locked for several weeks.
Theoretically, lateral movements can last several months, or even years in some cases. But given the nature Digital Currency Market High volatility, the probability of this happening is very low.
Below we will look at some medium-term technical signals and blockchain data that could give us some insight into price direction in the coming weeks. And the possible scenario of an upward movement expected by most market participants and analysts.
By the way, remember that these are just expectations and might not come true, even if there is almost complete consensus about them, because you don't know what developments might happen in the future . You should always negotiate with the possibility that your expectations may be wrong.
Technical Indicators Suggest Bitcoin Will Rise Again
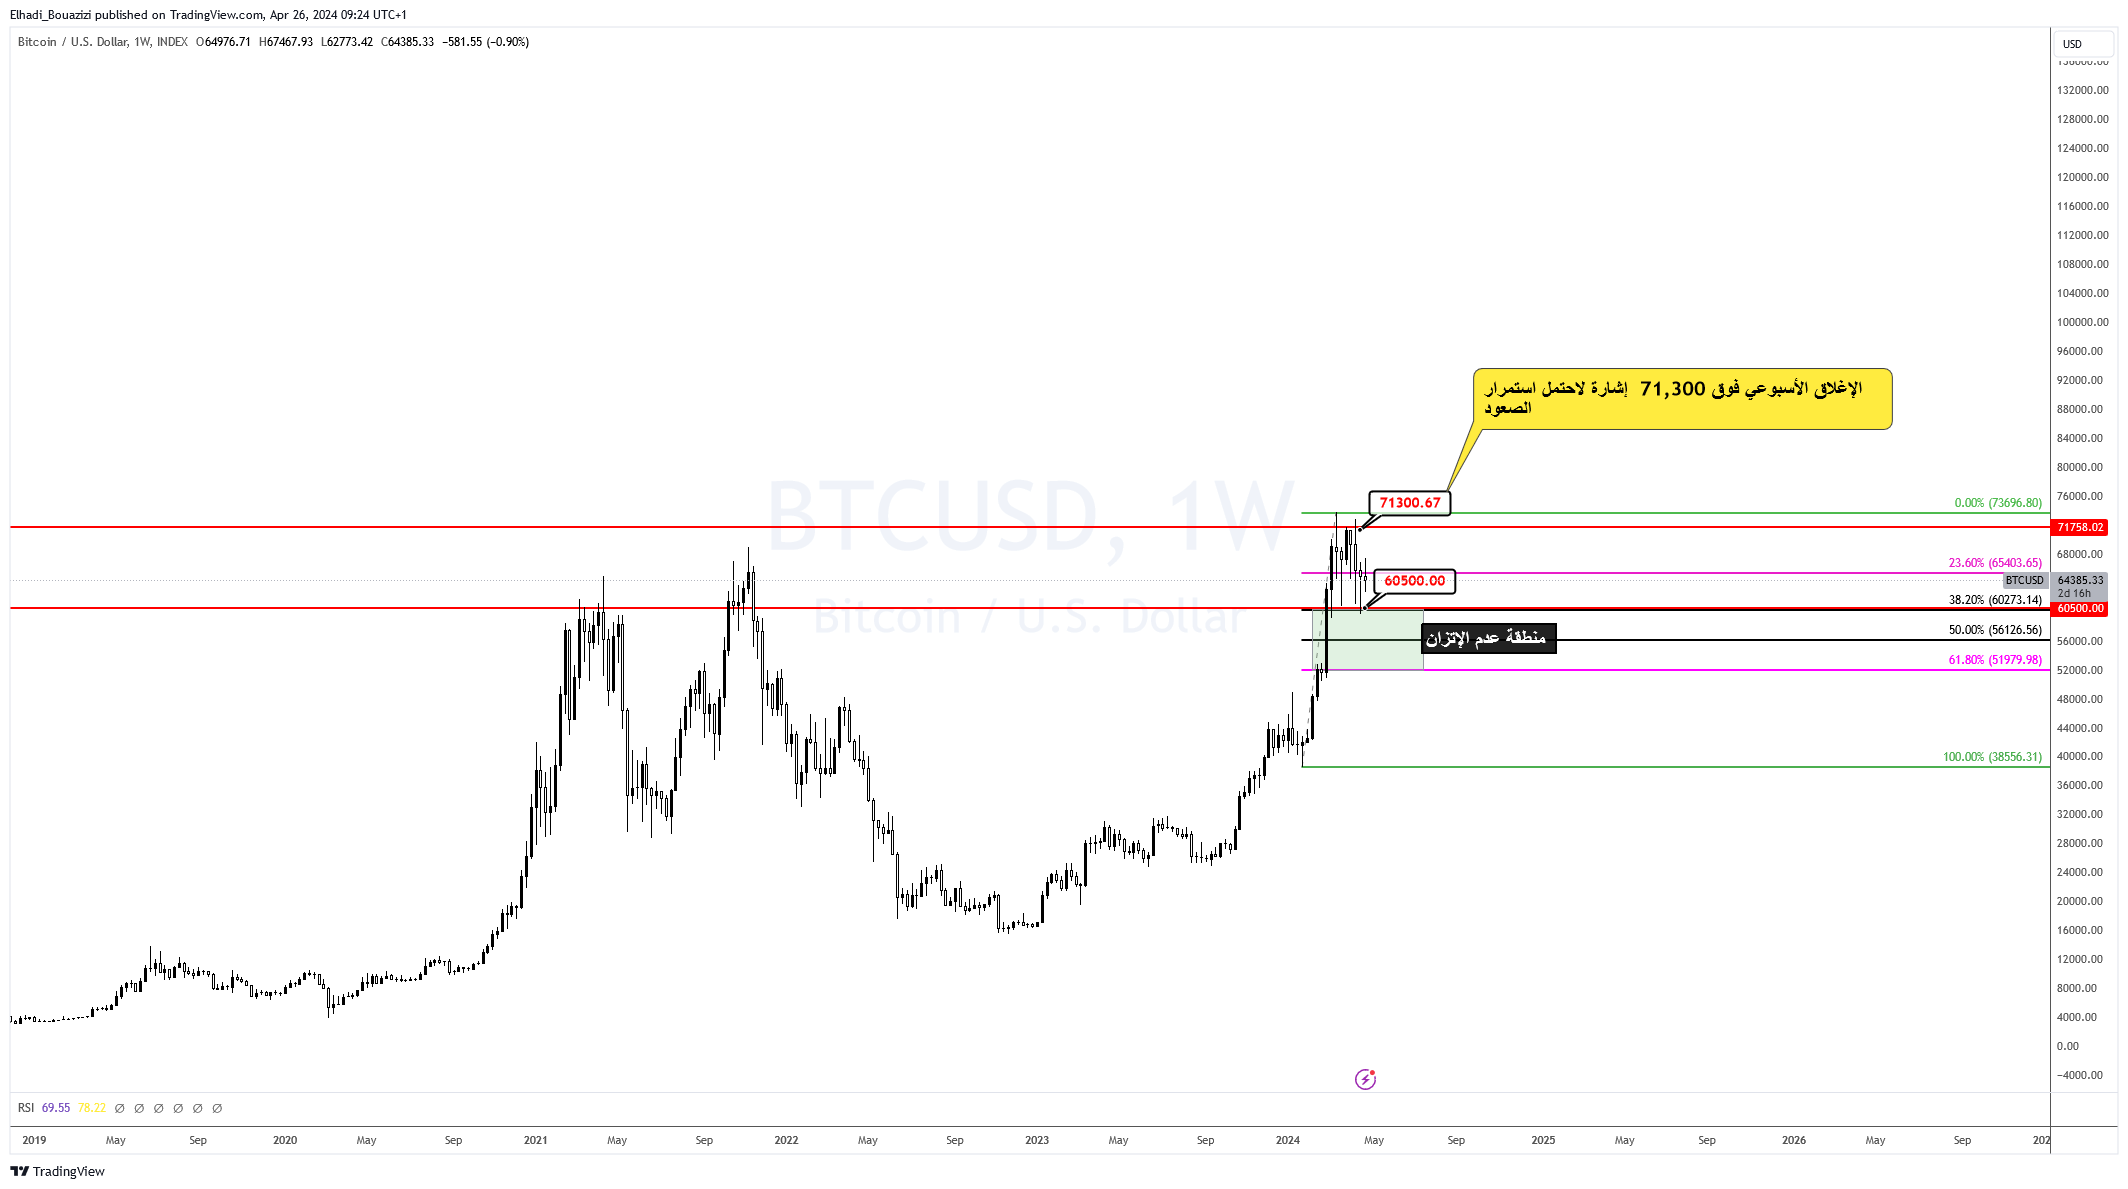
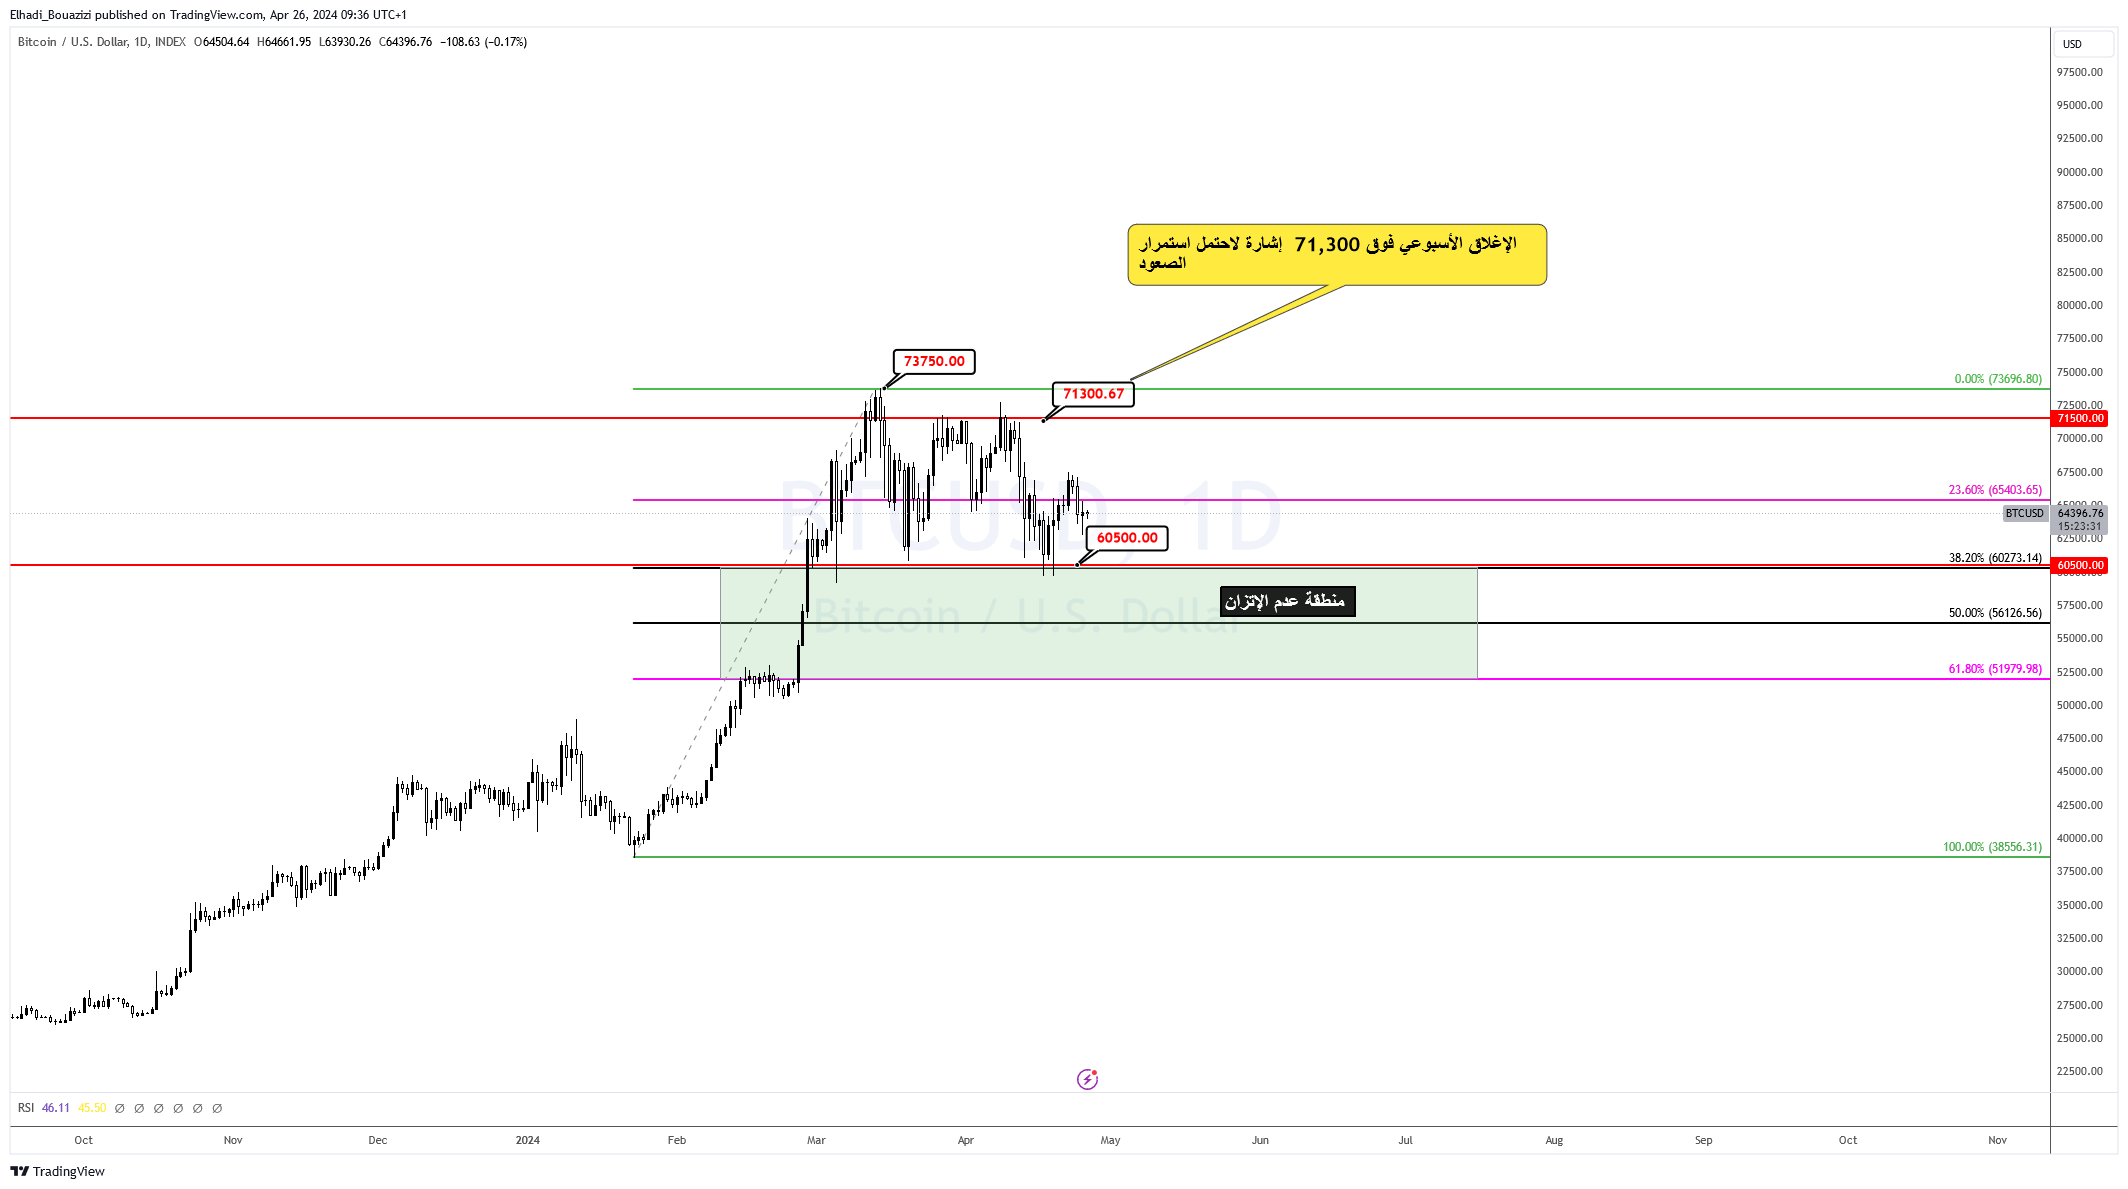
Whirling Bitcoin BTC Price It is currently above an unbalanced zone on the chart between $60,500 and $52,500.
In the context of technical analysis of financial markets, the term "imbalance" on a chart refers to a price zone in which there is no significant resistance or support from buyers and sellers.
These zones usually appear when there is a sharp and rapid price movement in a certain direction. This leaves a gap between prices that are not heavily negotiated.
Traders often view imbalanced areas as opportunities to buy if they are below the current market or sell if they are above.
This area is confined between the 38.2 to 61.8 Fibonacci retracement levels and is free of any previous highs or lows.
This area represents the key to activating purchase orders from potential investors.
The ideal scenario for a Bitcoin price recovery is a limited correction that attracts more buyers and brings the price back into the imbalance zone. Depending on the buying pressure, the price recovery could turn into a resumption of a strong uptrend.
If buyers manage to increase the price again, Bitcoin will encounter resistance at the highest weekly closing price of the year, around the $71,300 level.
If the main coin manages to close the week above this level, a new high will form after weeks of decline. Furthermore, the daily close is above the all-time high around $73,750.
This will build confidence in the digital currency market and jump-start Bitcoin's potential upward trajectory towards the psychological price of $80,000.
Serial Indicators Support Positive Forecast
According to data from the Santiment platform, Displays the market value to realized value ratio (MVRV) indicator. More than 30 days. Investors who purchased Bitcoin over the past month have made limited profits or may have suffered losses.
Bitcoin's market cap to 30-day realized value (MVRV) ratio is currently hovering around -3.00% after recovering from -8.25% over the past few weeks.
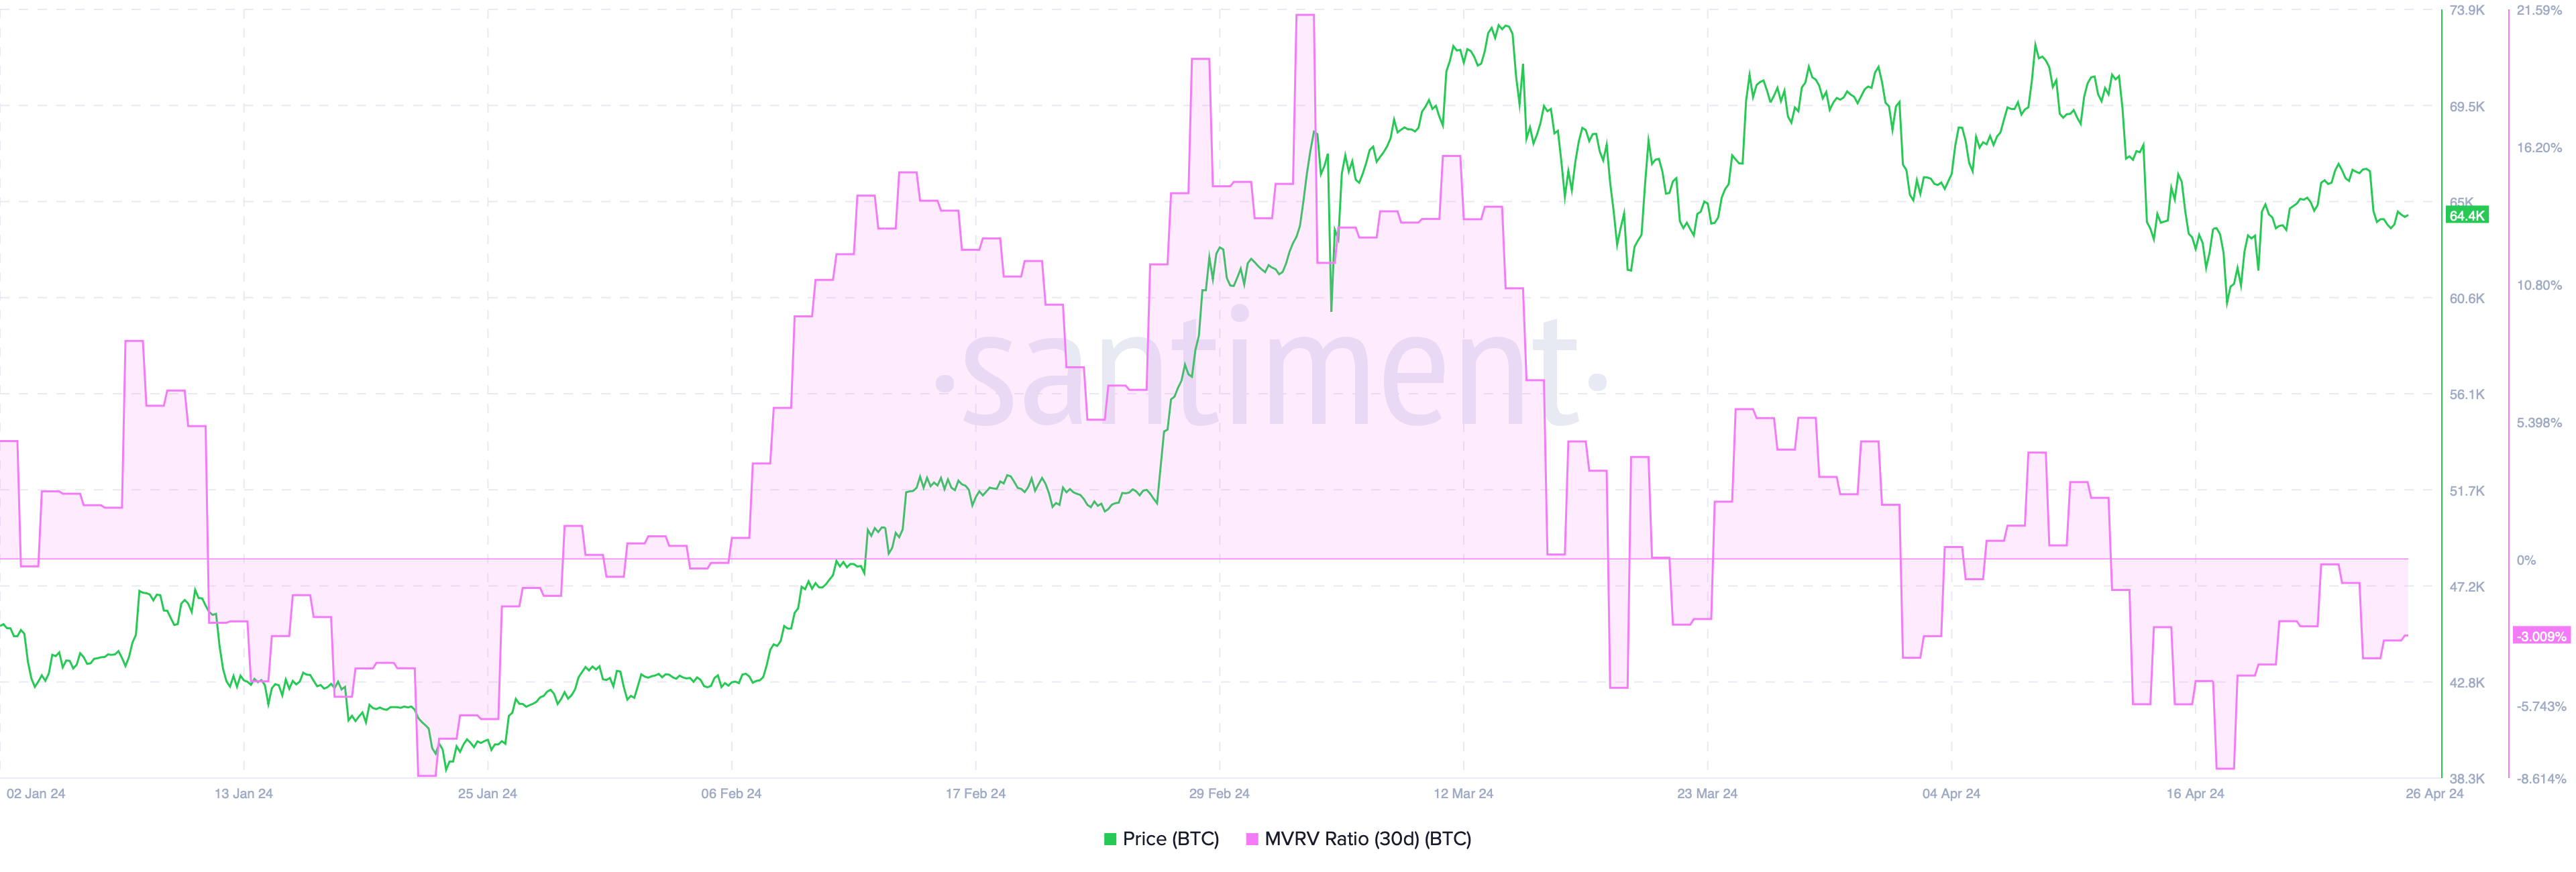
This indicator is often used to determine the average profit or loss of investors over a specific period of time. A negative number for the indicator indicates the possibility of buying, since losses favor cheap purchases.
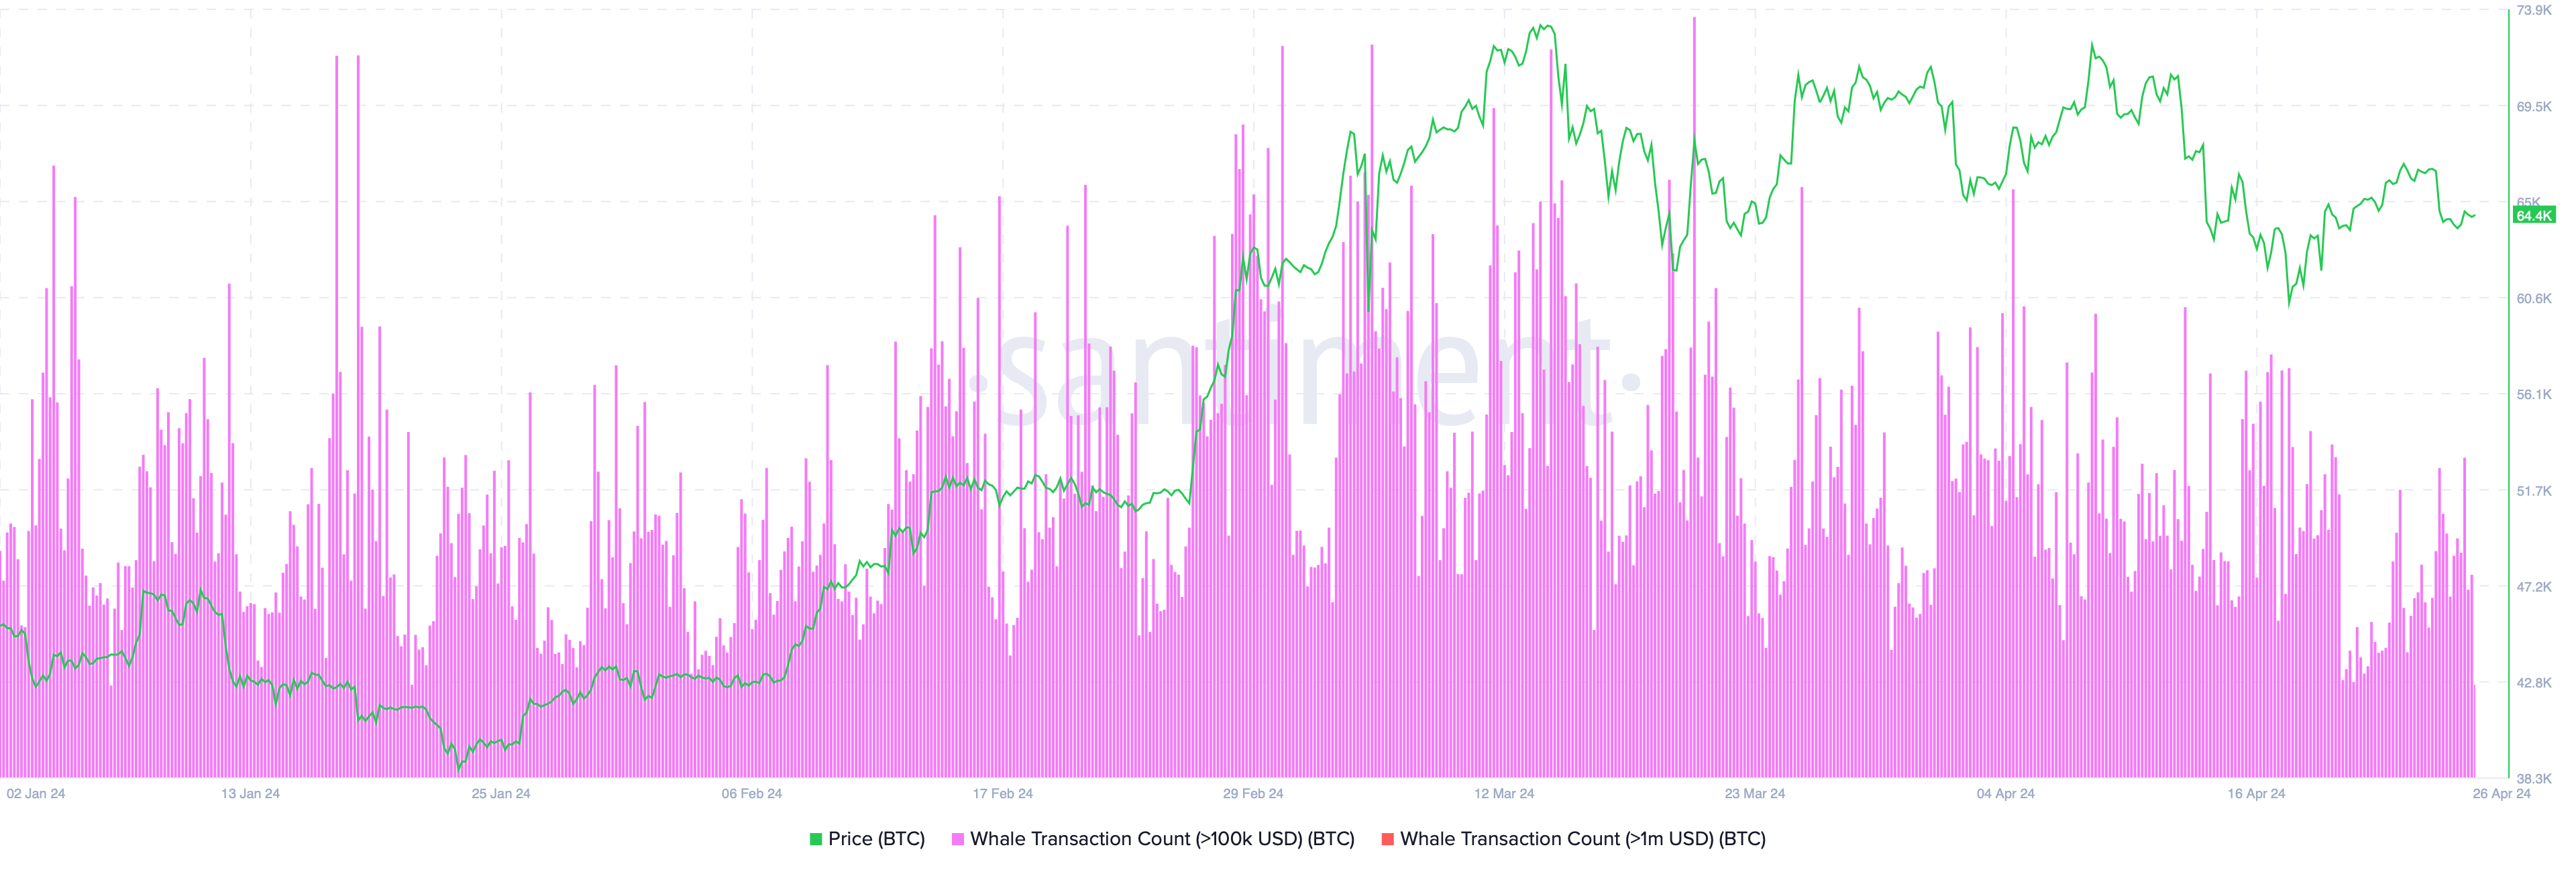
The Whale Transaction Count (WTC) indicator, which tracks Bitcoin (BTC) transfers worth $100,000 or more, showed spikes every time the price fell.
This means that large investors take advantage of any price drop to buy more Bitcoin and strengthen their positions.
The essential
Technical indicators and analysis strongly suggest the possibility of an upward rebound For Bitcoin. Investors should, however, be patient and wait for a limited decline.
If the price does not fall into the imbalance zone, it could involve deception by large investors to lure small investors with a quick rebound wave.
However, if the price falls below the imbalance zone to new low levels, the continuation of the downtrend will be confirmed. The $45,000 price is the next support level.
Observation:
It is important to remember that these are just predictions that may or may not be right, and that you are solely responsible for your trading decisions.
The cryptocurrency market involves a high degree of risk, not just great opportunities for quick profits.
Best Cryptocurrency Trading Platforms
Of confidence
Disclaimer
All information published on our website is offered in good faith and for general information purposes only. Therefore, any action, behavior or decision taken by the reader in accordance with this information is solely the responsibility of itself and its affiliates individually, and the site assumes no legal responsibility for such decisions.
الأسواق,تحليلات,تحليلات تقنية,تقرير إخباري,العملات الرقمية,بت كوين,بيتكوين
Comments
Post a Comment