

Solana (SOL) price continues to undergo a corrective phase, sparking speculation of further declines or a possible bullish reversal.
Initially, Solana showed recovery from the golden ratio support located around $125. However, contrary to expectations of an easing of the corrective trajectory, the price appears to continue falling.
Solana Tracking: A Brief History of SOL Price Action
After hitting a local high near $209, Solana saw a sharp correction to around $162.5, indicating the start of a corrective phase. Later, the formation of a lower high confirmed the continuation of the corrective movement.
After bouncing from golden ratio support around $125, Solana briefly hit the 50-day EMA at around $155, only to encounter resistance and undergo another correction period. Currently, Solana finds notable Fibonacci support around $143.
A potential rebound from this support level could push Solana towards a retest of the 50-day EMA at $155, with further upside towards the golden ratio near $175. However, resuming the uptrend will require a decisive break above golden ratio resistance.
Conversely, a downward break of the .382 Fibonacci support at around $143 could trigger a bounce in Solana towards the golden ratio support at $125. Further bearish momentum could target the 200-day EMA around $111.
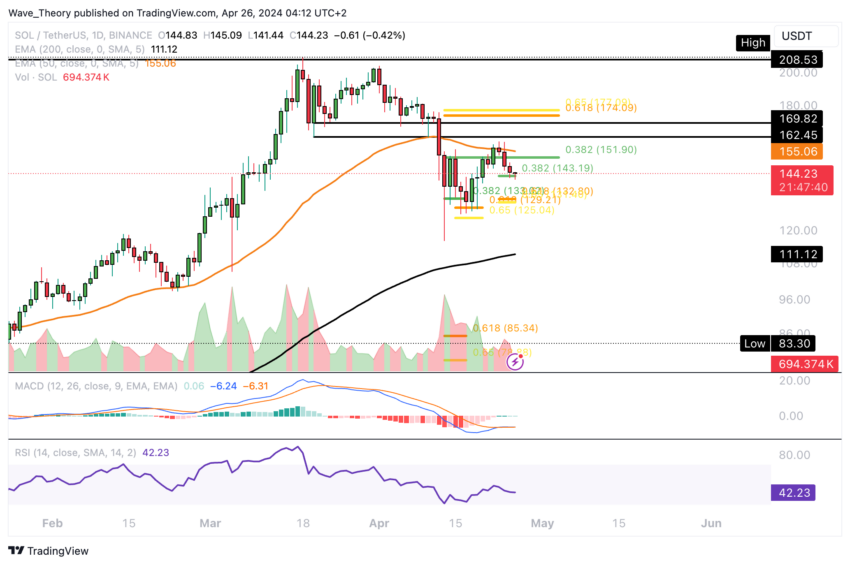
On the daily chart, the MACD histogram reflects a recent downtrend, while the MACD lines are close to each other, indicating the possibility of bullish and bearish crossovers. Meanwhile, the RSI remains neutral and a golden cross on the exponential moving averages indicates a continued bullish outlook in the short to medium term.
A death cross forms on the Solana 4H map
On the 4-hour chart of Solana, a deadly cross formation on the EMA indicates a confirmed short-term downtrend. Additionally, the bearish crossover of the MACD lines, coupled with the neutral position of the RSI, further strengthens this sentiment.
Despite these indicators, the MACD histogram shows an upward trend, indicating some potential for near-term upward movement. Solana could regain support around the .382 Fib level at around $143, with a potential target for the 50-4H EMA around $149.5.
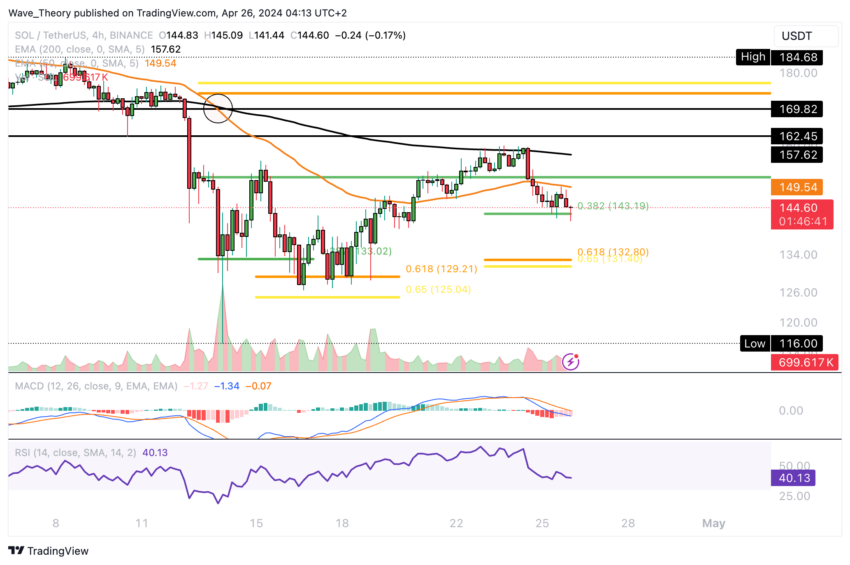
However, the recent bearish rejection at this level highlights the challenges Solana faces in the current price action.
Why Solana Crashed 45%: Factors Behind the Sharp Drop
Over the past six weeks, the price of Solana has undergone a correction of more than 45%. If this corrective phase continues, major support for SOL should lie between around $79 and $89.5. This range corresponds to the intersection of the 50-week EMA and the critical support of the golden ratio.
Maintaining Solana price above the golden ratio threshold at around $85 is key to sustaining the upward trajectory. However, the weekly chart information paints a bearish picture. The MACD lines are currently undergoing a bearish crossover, while the MACD histogram indicates a downward trajectory.
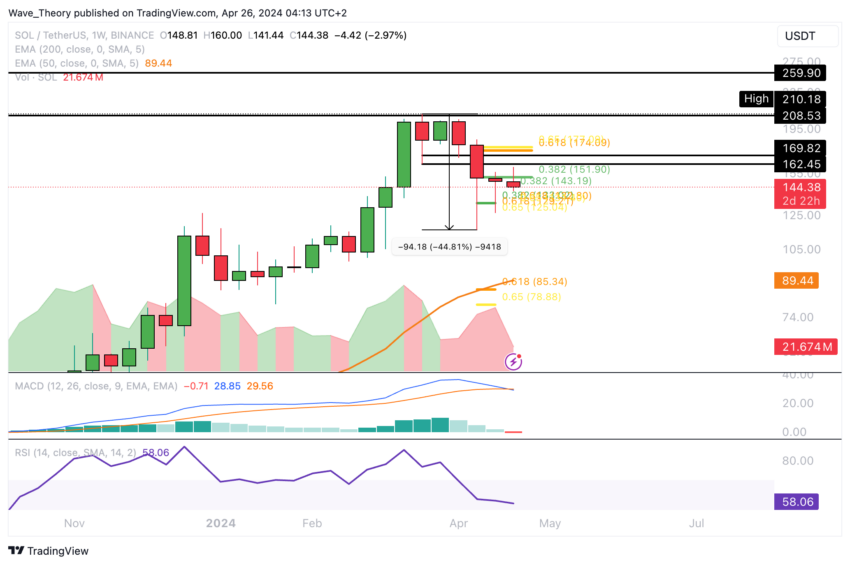
At the same time, the RSI remains neutral, devoid of obvious bullish or bearish signals.
Bearish signs: MACD histogram on monthly chart is falling
The current month has seen a price drop of around 43.3%. This decline is reflected in the MACD histogram, which now indicates a downward trend.
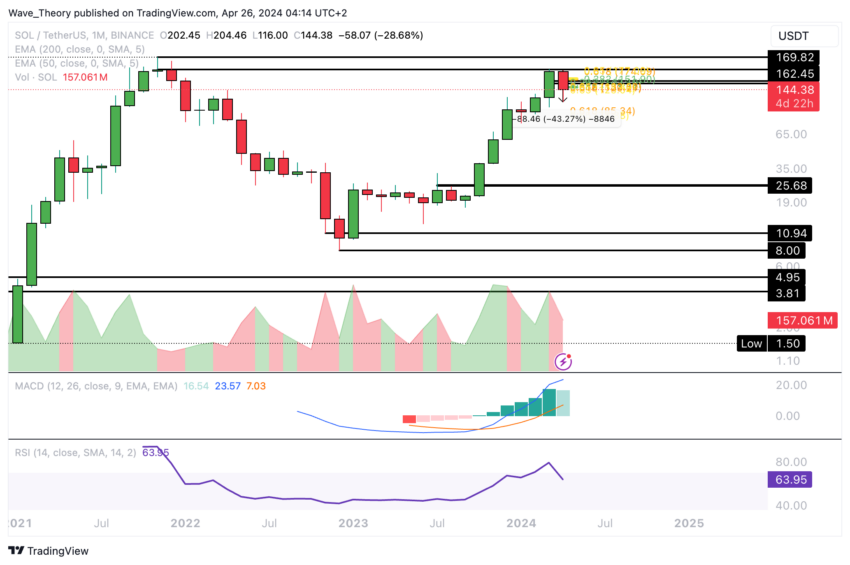
However, on the monthly chart, the MACD lines continue to cross upwards, indicating a continuation of the uptrend. Additionally, the Relative Strength Index returned to the neutral zone, indicating a potential stabilization of market sentiment.
Solana vs. Bitcoin: Expect a Bullish Bounce from Fib Support
Against Bitcoin, Solana currently finds itself supported in a range of 0.0021 BTC to 0.0023 BTC. This represents a potential opportunity for an upward rebound.
However, it is worth noting that on the weekly chart, the MACD lines have crossed downwards and the MACD histogram is showing a downward trend, indicating a downtrend. At the same time, the RSI remains in the neutral zone, lacking clear bullish or bearish signals.
Learn more: Solana (SOL) Price Forecast for 2024, 2025, 2026, 2027
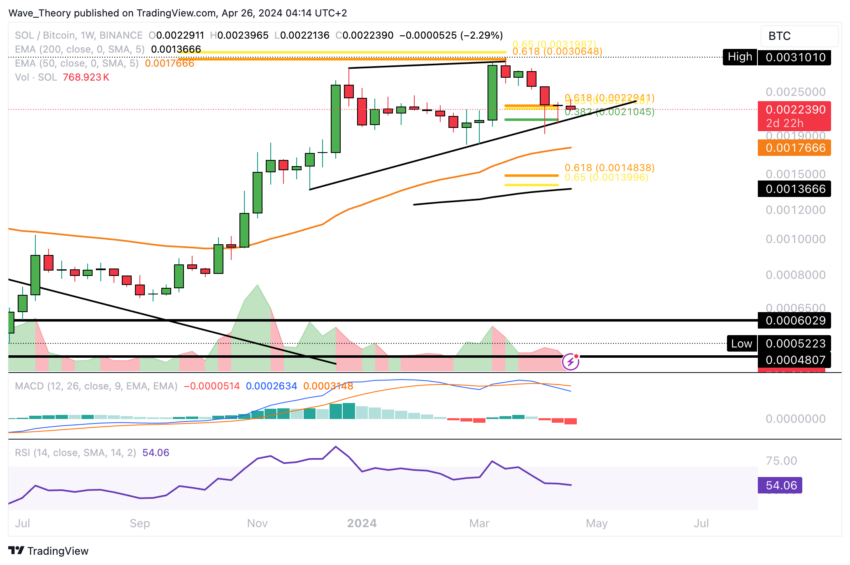
In the event of a downside breakout, Solana could face significant Fibonacci support around 0.00145 BTC. Before that, additional support can be expected near the 50-week EMA at around 0.001766 BTC.
Best Cryptocurrency Trading Platforms
Of confidence
Disclaimer
All information published on our website is offered in good faith and for general information purposes only. Therefore, any action, behavior or decision taken by the reader in accordance with this information is solely the responsibility of itself and its affiliates individually, and the site assumes no legal responsibility for such decisions.
الأسواق,SOL,العملات الرقمية,العملات المشفرة
Comments
Post a Comment