

Ethereum (ETH) price is currently undergoing a correction, with the price approaching key Fibonacci support levels. Whether or not Ethereum will break this support in a bearish manner remains unclear.
Whether Ethereum hits a new yearly low largely depends on market dynamics and investor sentiment. While there is always the possibility of further decline, it is also plausible that Ethereum could reverse its trend and start rising again in the near future.
Ethereum Price Trend: Ongoing Correction Continues
Ethereum price has seen a decline of approximately 31.3% since reaching its last high at approximately $4,094 in the month preceding the last. This large corrective move coincided with a downward trend in the Moving Average Convergence/Divergence (MACD) chart since last month.
Despite these bearish indicators, the MACD lines currently remain bullishly crossed, while the Relative Strength Index (RSI) remains neutral. Ethereum is currently facing major Fibonacci support at around $2,866.
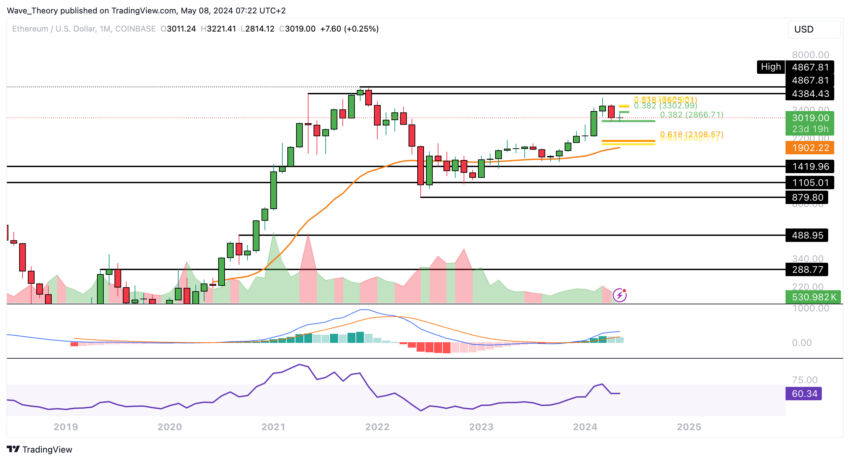
If Ethereum breaks below this support level, the next major Fibonacci support is expected to be around $2,100. However, maintaining a position above this level is likely to maintain bullish momentum in the medium term.
Read more: Everything you need to know about Ethereum funds and altcoin season
Additionally, the 50-month EMA at around $1,900 provides complementary support to the Ethereum price.
Ethereum Weekly Forecast: MACD Shows Bearish Signs
If Ethereum breaks below the current Fibonacci support level, subsequent major support is expected to be at the 50-week EMA, around $2,520. It is worth noting that the MACD indicator shows a clear downward trend on the weekly chart.
This is evidenced by the MACD histogram, which has seen a consistent bearish decline over the past few weeks. Additionally, the MACD lines crossed to the downside.
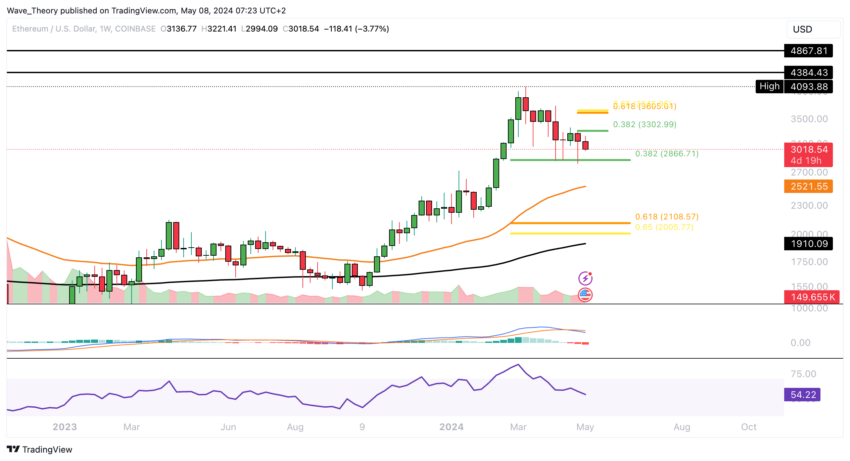
On the other hand, the RSI remains neutral and the exponential moving averages continue to maintain a golden crossover, indicating a medium-term uptrend.
Will Ethereum return to $2,866? Fibonacci Level Analysis 0.382
Ethereum appears to be poised to revisit the .382 Fibonacci support level at around $2,866, with additional support expected around the 200-day EMA at around $2,814.
When looking at the MACD, the lines are approaching a potential bearish crossover, while the MACD histogram has shown a downward trend in recent days, indicating bearish sentiment.
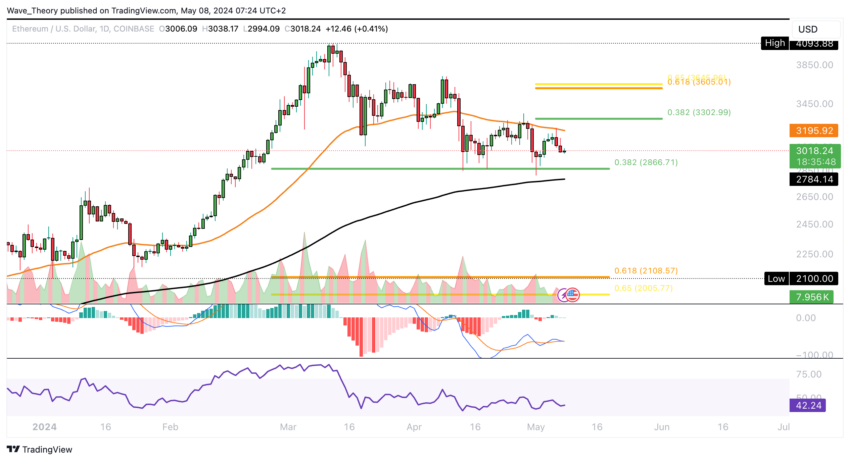
In contrast, the Relative Strength Index remains neutral and provides no clear indication of upward or downward momentum. At the same time, the EMAs maintain a golden crossover, indicating an uptrend in the short to medium term. The corrective phase therefore appears to be continuing at present.
Can Ethereum reverse its current correction?
To reverse the ongoing corrective phase, Ethereum price needs to cross the 0.382 Fibonacci resistance level at around $3,303, followed by the golden ratio at around $3,700, indicating a return to the bullish path. However, indicators on the 4-hour chart are mostly showing bearish signals.
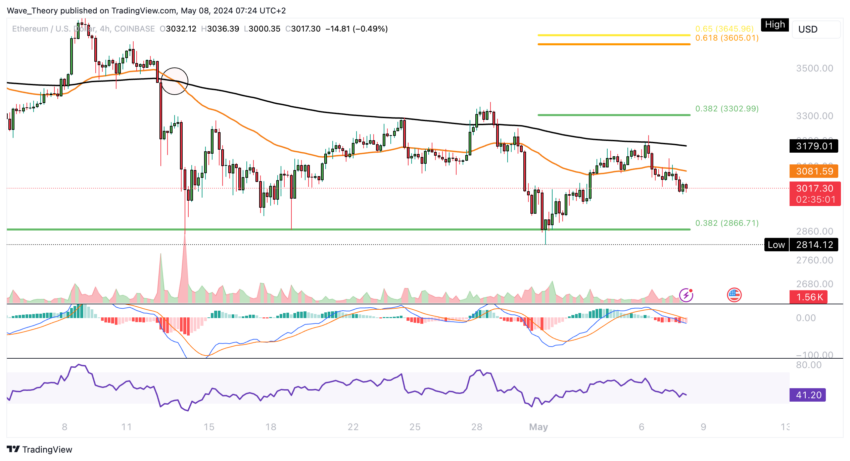
The exponential moving averages have formed a death cross, confirming the current short-term downtrend. Additionally, the MACD lines crossed to the downside, accompanied by a downward trend in the MACD histogram, while the RSI maintained a neutral position.
Ethereum vs Bitcoin: ETH continues its downward trend
Downtrend continues for Ethereum vs BTCwhere you face Ethereum The huge support is around 0.043 BTC, which is close. The MACD lines have entered the bearish zone, with the chart showing a downward trend since the previous week. Despite this, the Relative Strength Index remains neutral.
Read more: Ethereum (ETH) Price Forecast for 2024, 2025, 2026, 2027
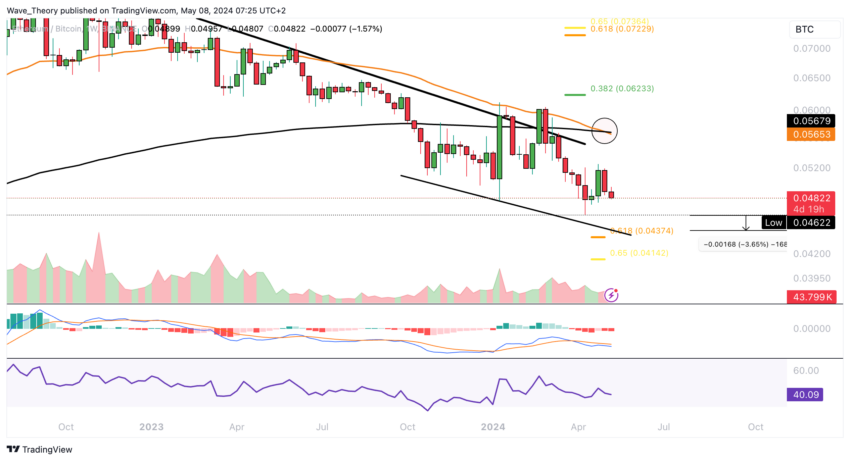
Additionally, the EMAs are on the verge of forming a bearish crossover, indicating a potential long-term downtrend in the medium term. Ethereum's position against BTC is clearly bearish.
Best Cryptocurrency Trading Platforms
Of confidence
Disclaimer
All information published on our website is offered in good faith and for general information purposes only. Therefore, any action, behavior or decision taken by the reader in accordance with this information is solely the responsibility of itself and its affiliates individually, and the site assumes no legal responsibility for such decisions.
الأسواق,إيثريوم,العملات الرقمية,العملات المشفرة
Comments
Post a Comment