

After the recent bearish rejection of resistance, the price of Solana (SOL) has undergone a correction. However, over the past day, SOL price has increased by over 9%.
It remains uncertain whether SOL price will successfully break through resistance or face another bearish rejection, triggering a further correction.
Solana Price Rises 9%: Creating Momentum for Higher Prices
Four days ago, SOL price faced a bearish rejection at the resistance zone, extending from approximately $157 to $160, continuing its downward trajectory. However, SOL saw a notable rally yesterday, posting gains of over 9%.
Currently, SOL appears to be maintaining its bullish momentum as it once again faces significant resistance in the $157-$160 range. A break beyond this resistance could push SOL towards critical Fibonacci resistance at around $175, marking Possible end of the correction phase.
The dominant indicators are trending upward. Notably, the exponential moving averages display a golden crossover, indicating an uptrend in the short to medium term.
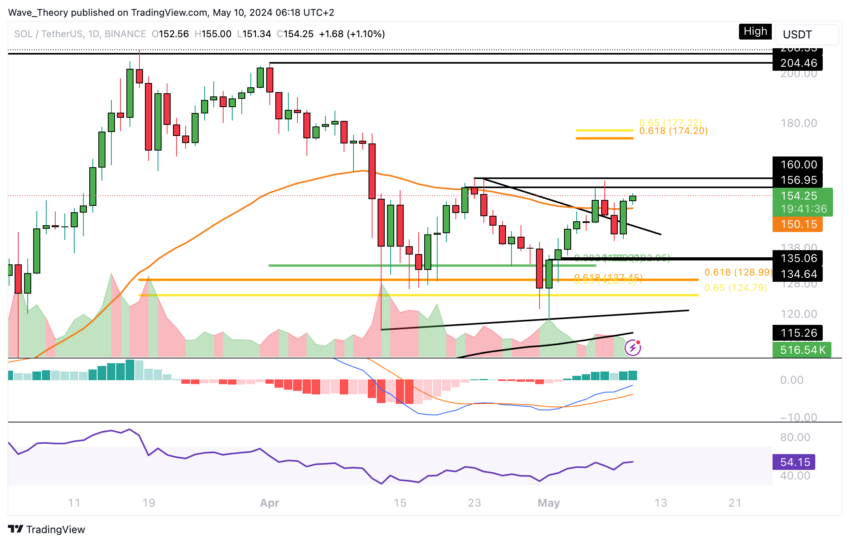
Furthermore, the MACD lines are bullish , accompanied by a bullish sign in the MACD histogram since yesterday. However, the Relative Strength Index (RSI) remains neutral at the moment.
Solana 4-hour chart shows current uptrend
According to the 4-hour chart, the indicators mainly reflect bullish expectations. The MACD lines show a bullish crossover, accompanied by an uptrend in the MACD histogram, while the RSI remains inconclusive, offering no distinct signal.
Learn more: How to Buy Solana (SOL) and Everything You Need to Know
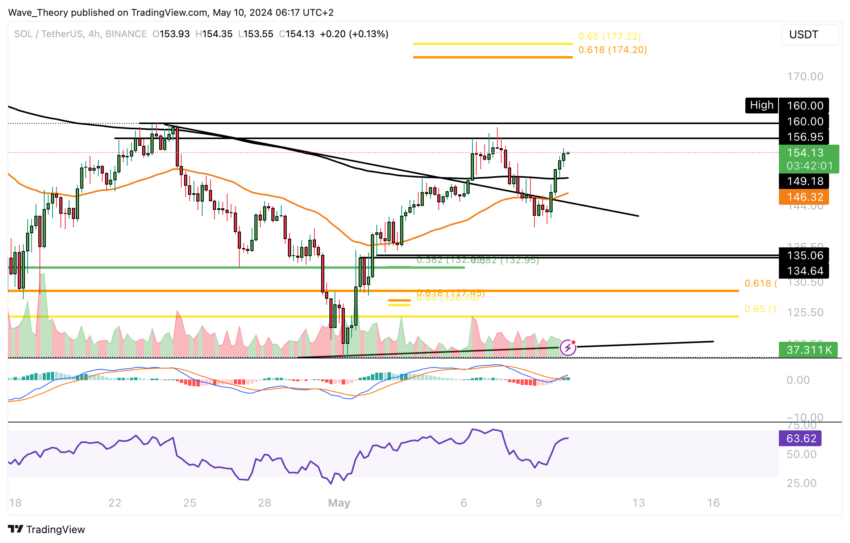
Additionally, it is possible that the EMAs will soon form a golden cross, which would strengthen the bullish sentiment in the short term. However, it is worth noting that the death cross remains intact at the moment, indicating a short-term downtrend.
What if Solana once again faced bearish rejection in the face of resistance?
If Solana faces another downside rejection at the resistance zone extending around $157 to $160, it could resume its decline towards the Fibonacci support levels between around $125 and $133.
If it fails to break this resistance, Solana could test critical Fibonacci support around $85. The 50-week EMA near $94 is also a notable support level.
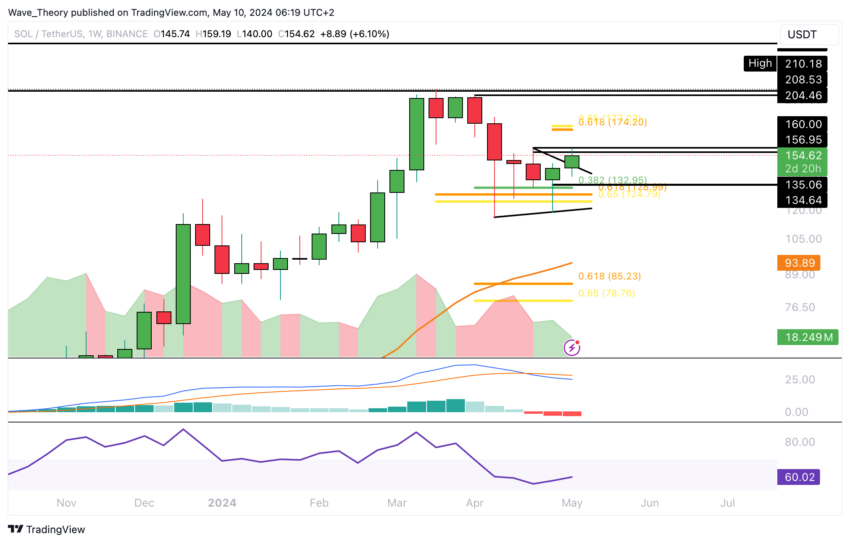
On the weekly chart, the MACD lines remain bearish, accompanied by a downtrend in the MACD histogram, while the RSI oscillates in the neutral zone.
Solana Monthly Chart Analysis: MACD Histogram Shows Downtrend
On the monthly chart, the MACD histogram shows a downward trend since last month, indicating a continuation of the SOL correction phase. Despite a slight recovery in SOL price this month, the MACD histogram has yet to show any bullish momentum.
However, a bullish crossover of the MACD lines and a neutral position of the RSI indicate a potential change in momentum. Whether Solana will maintain its correction and approach the $85 level in the medium term largely depends On its ability to overcome the resistance of the golden ratio At around $175.
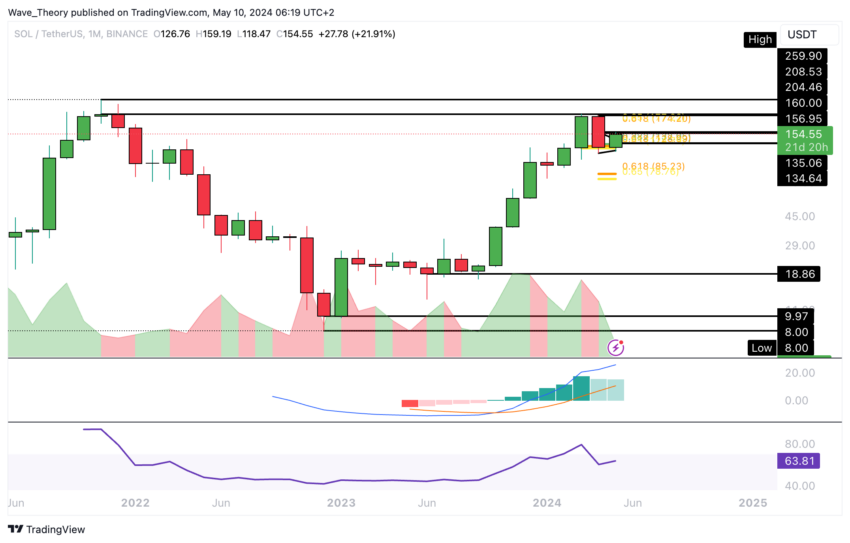
Maintaining the price level above $85 would support the upward trajectory in the medium term. Conversely, failure to do so could indicate a return to the downtrend, which could cause the price to fall, such as $19.
Solana gains momentum against BTC
Compared to BTC, Solana recently saw a bullish rebound from Fibit support from 0.382 to around 0.0021 BTC, indicating a potential reversal. This week, Solana appears to clear 0.382 Fib resistance around 0.00237 BTC, setting the stage for a potential move towards golden ratio resistance at 0.00268 BTC.
A successful breakout above this level could mark the end of the corrective phase for the time being, which could allow Solana to target the golden ratio resistance at around 0.003 BTC.
Learn more: Solana (SOL) price forecast 2024/2025/2030
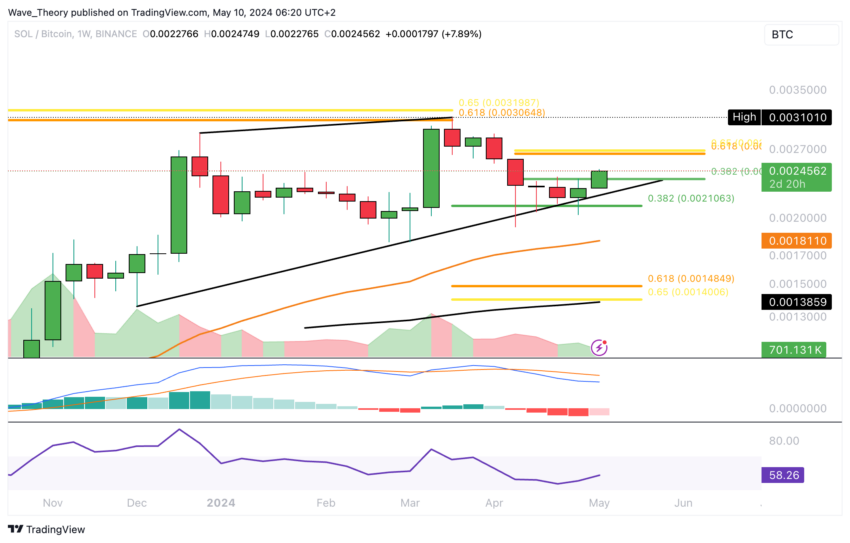
While the MACD histogram shows signs of bullish momentum this week, the MACD lines remain crossed to the downside and the RSI maintains a neutral position.
Best Cryptocurrency Trading Platforms
Of confidence
Disclaimer
All information published on our website is offered in good faith and for general information purposes only. Therefore, any action, behavior or decision taken by the reader in accordance with this information is solely the responsibility of itself and its affiliates individually, and the site assumes no legal responsibility for such decisions.
الأسواق,تحليل سولانا (SOL)
Comments
Post a Comment