

Whales have benefited from the recent decline in Cardano (ADA) staking, leading to a notable stabilization of ADA price over the past week. This period of accumulation coincided with a decrease in the number of short-term traders holding ADA. This indicates a potential reduction in price volatility.
Meanwhile, the exponential moving average lines of ADA price show a consolidation pattern, indicating market equilibrium. Despite this, a Golden Cross is expected in the near future. This is a technical signal often associated with bullish momentum. This could indicate a positive change for ADA price. Which indicates that the current stability could be the prelude to an upward movement.
Whales Buy Cardano ADA Drop
From March 11 to March 20, Cardano price witnessed ADA down. It went from $0.71 to $0.57. During this period, the number of addresses holding more than 10,000,000 ADA saw a slight increase. It increased from 397 to 403. This change also indicates that whales took advantage of the decline to increase their ADA holdings.
But after the price hit $0.57 on March 20, this accumulation trend stopped and the number of high-volume ADA addresses remained largely unchanged. A glimmer of hope appeared despite whale numbers stagnating over the following week.
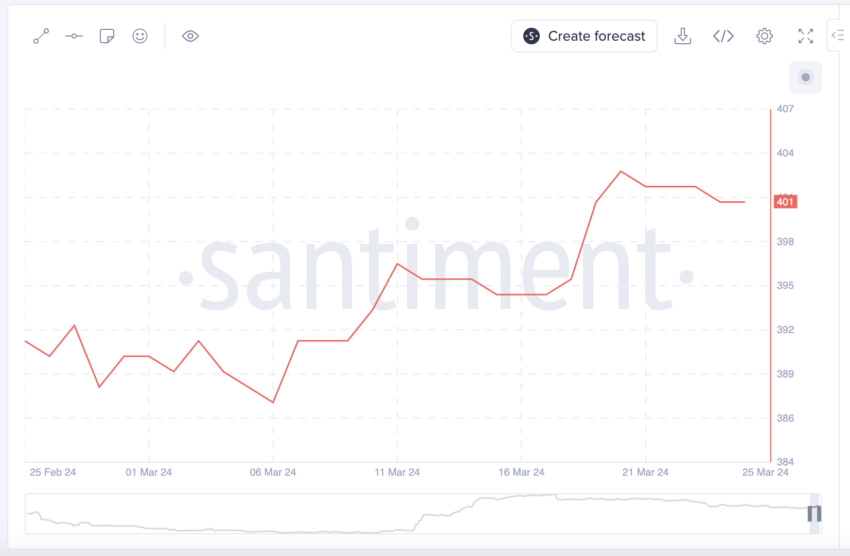
Between March 20 and 25, ADA price rebounded to $0.66, providing a potential profit margin for whales who had recently increased their stakes. This pause in accumulation after March 20 could indicate a strategic pause on the part of the whales, as they are likely now closely monitoring market dynamics, waiting for further price movements to guide their next moves.
Read more: Will Brave accept ADA on its digital wallet?
Low number of traders
Traders, defined as addresses that have held the asset for less than a month, saw a significant increase in ADA, with their numbers increasing from 244,000 on February 1 to 303,000 on March 18. During the same period, the price of ADA increased from $0.49 to $0.69.
This increase in the number of short position holders is generally associated with increased volatility of the asset, given the tendency of these participants to make frequent purchases and sales.
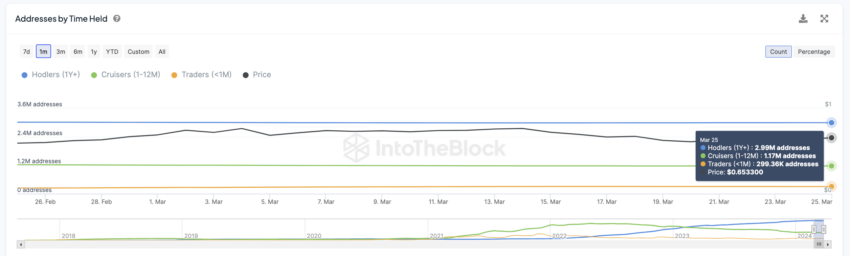
However, a noticeable change occurred from March 19, as the number of such traders began to decline. From this date, the number of ADA addresses classified as merchants has steadily declined. This number decreased slightly to 299,000 from the peak of 303,000 seen a week ago. Although this drop may seem minor, it is significant enough to indicate potential future trends in market behavior.
Specifically, a decline in the number of short-term traders may indicate a shift toward less price volatility in ADA. This change may indicate a stabilization in the market environment, as fewer traders making rapid trades may result in a more stable and predictable price movement for ADA.
ADA Price Forecast: Will the Uptrend Continue?
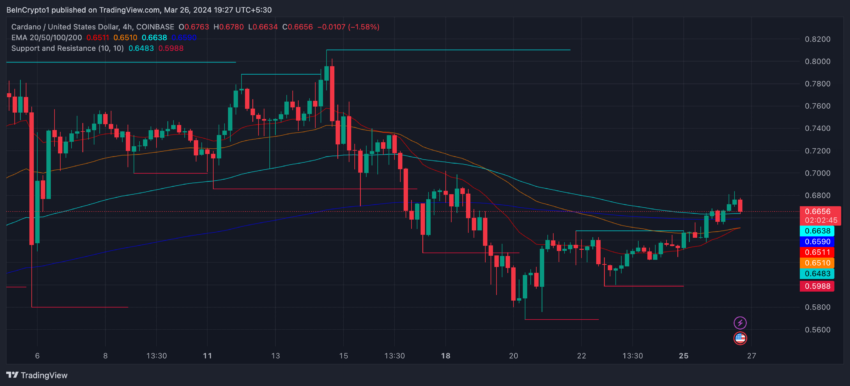
ADA price increased by 14.24% over the last six days. The big question is: will the uptrend continue? Analyzing the 4-hour price chart, we see that the price line is currently above all exponential moving average (EMA) lines, which is a bullish signal.
When the short-term EMA line crosses above the long-term EMA line, which is almost always the case with the ADA price chart, this is often interpreted as a bullish signal. This indicates that the recent price momentum is outpacing the long-term trend and could lead to higher prices.
This specific crossover event is known as a “golden crossover” and is a widely recognized indicator that indicates a potential long-term bullish breakout.
EMA lines are technical analysis tools used to smooth price data over specific time frames, providing a clearer view of price direction. Unlike simple moving averages, exponential moving averages focus more on recent prices. This makes it more responsive to market changes and more valuable in identifying trend directions and potential reversal points.
If the uptrend continues, Cardano ADA price may rise very soon to test and break the resistance at $0.82. However, if the Golden Cross is not sustainable and a downtrend begins, its price could decline to the $0.56 area.
Best Cryptocurrency Trading Platforms
disabled:bg-grey-300 disabled:border-grey-300 disabled:text-grey-100 bic-c-button-secondary mt-4" rel="noopener">
Learn more
Of confidence
Disclaimer
All information published on our website is offered in good faith and for general information purposes only. Therefore, any action, action or decision taken by the reader in accordance with this information is solely the responsibility of it and its affiliates individually, and the site assumes no legal responsibility for such decisions.
الأسواق,العملات الرقمية,العملات المشفرة
Comments
Post a Comment